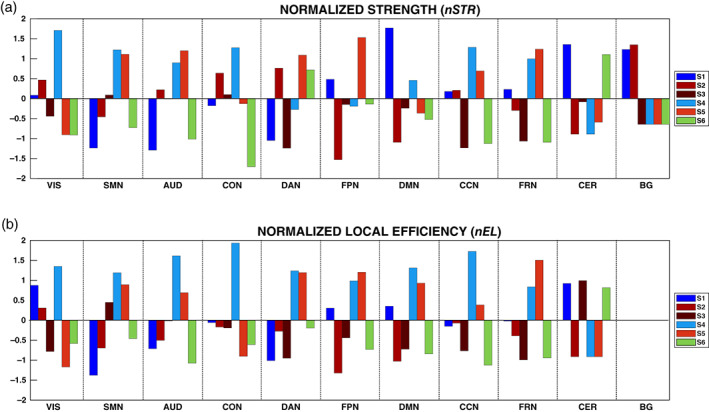
FIGURE 7.

In Panels (a) and (b), we show the normalized values of the strength (nSTR) and local efficiency (nEL) for the states, colored differently, and in the functional domains. Given that, after proportional thresholding of the FC matrices, the local efficiency resulted to be 0 for the basal ganglia (BG) in all the states, in Panel (b) no values of nEL are reported for the BG. The labels S1, S2, and so forth refer to State 1, State 2, and so forth
