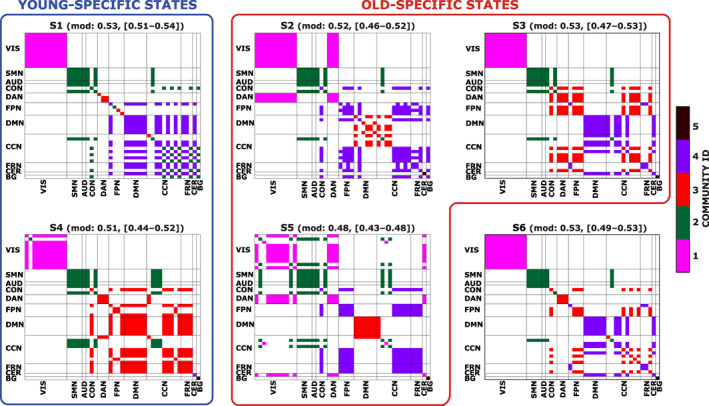
FIGURE 8.

Each figure represents the modular organization of a brain state (S1, S2, etc.) obtained as explained in the main text. Different colors are representative of a distinct community. In both the x‐ and y‐axis, we have the 46 ICs, divided in the 11 functional domains. In the title, we also report the mean modularity value, obtained across the 50,000 realizations, together with the minimum and maximum values. We grouped together states mostly populated by young subjects (blue box) and by old subjects (red box)
