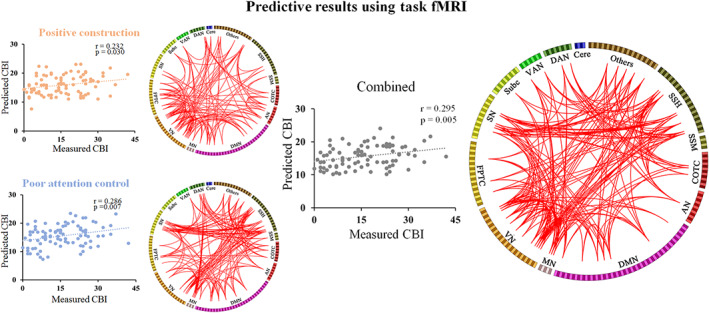
FIGURE 2.

Predictive results using task‐based functional connectivities (FCs). The scatterplots show the correlation between measured and predicted Creative Behavior Inventory (CBI) scores. The circle plot shows FCs that can predict CBI scores. The top 20% regions with the largest number of connections were present for visual presentation. AN, auditory network; Cere, cerebellar; COTC, cingulo‐opercular task control network; DAN, dorsal attention network; DMN, default mode network; FPTC, fronto‐parietal task control network; MN, memory retrieval network; SN, salience network; Subc, subcortical network; SSH, sensory/somatomotor hand network; SSM, sensory/somatomotor mouth network; VAN, ventral attention network; VN, visual network
