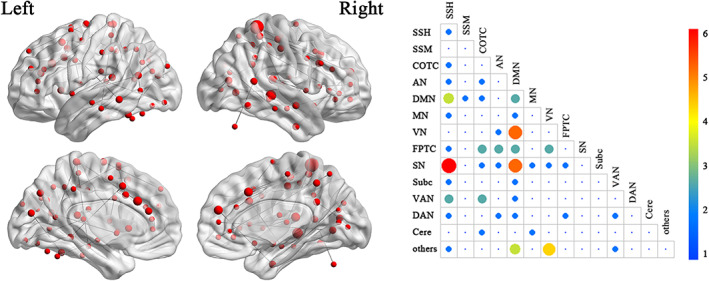
FIGURE 4.

The overlap between task functional connectivities (FCs) results and resting‐state FCs results. The brain map on the left shows the overlap FCs and the node size represents the degree. The right matrix map shows the connection number between brain networks. AN, auditory network; Cere, cerebellar; COTC, cingulo‐opercular task control network; DAN, dorsal attention network; DMN, default mode network; FPTC, fronto‐parietal task control network; MN, memory retrieval network; SN, salience network; Subc, subcortical network; SSH, sensory/somatomotor hand network; SSM, sensory/somatomotor mouth network; VAN, ventral attention network; VN, visual network
