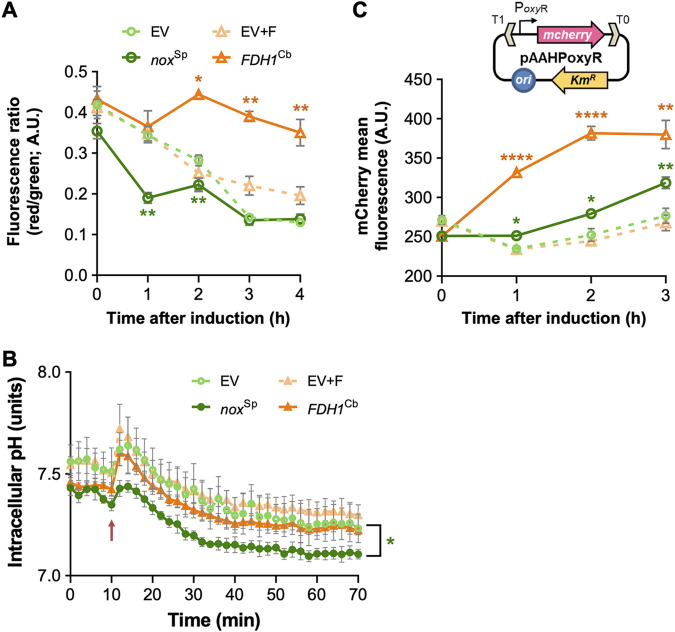
FIG 3.
Membrane potential, intracellular pH, and ROS formation in P. aeruginosa overexpressing noxSp and FDH1Cb strains. (A) The membrane potential was determined by means of the fluorescent membrane potential indicator dye DiOC2 in PA14 overexpressing either noxSp or FDH1Cb. Cells carrying the empty vector (EV) served as a control. Induction of the cultures was achieved in the early exponential phase of growth using 1 mM IPTG. A reduction in the fluorescence ratio (red/green) indicates a decrease in the membrane potential. The experiment was carried out in triplicate. (B) The intracellular pH was calculated using the ratiometric indicator protein PHP encoded in plasmid pS2513·PHP. Cells harboring the pH sensor and the plasmids encoding noxSp or FDH1Cb were grown in microtiter plates, and the pH was determined by calculating the ratio between the fluorescence peaks at λexcitation = 405 nm and λexcitation = 485 nm, as described in the experimental procedures. The time of induction with 1 mM IPTG is depicted in the plot with a red arrow. The average results of at least three independent replicates with their respective standard deviations are shown. (C) The formation of ROS was recorded in cells carrying the pAAHPoxyR reporter plasmid (caption in Fig. 3C). This Km-resistant vector couples the transcriptional activation of the mcherry fluorescent protein with the ROS-responsive oxyR promoter (PoxyR). Cells carrying this ROS sensor and the plasmids expressing either noxSp or FDH1Cb were grown to the early exponential phase of growth and induced with 1 mM IPTG. The mCherry-specific signal was recorded in a flow cytometer, and the mean fluorescence intensities were calculated from the whole-cell population. The symbols for each sample within the plot are the same as in Fig. 3A The experiment was carried out in triplicate. Significant differences in panels A and C were determined by unpaired t test with Welch’s correction: *, P < 0.05; **, P < 0.001; ****, P < 0.0001. In the case of the pH measurements (B), a Welch’s two-sample t test on ranked data was performed. The P values for the different time points were corrected using the false discovery rate (FDR). Check the experimental procedures and Fig. S6 for details.

