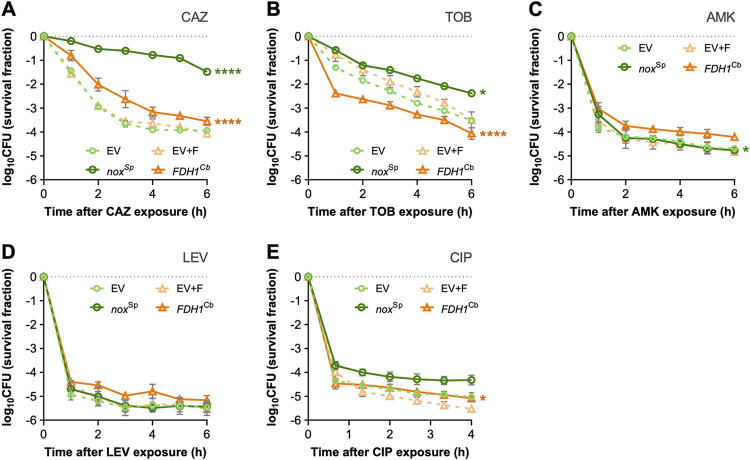
FIG 6.
Killing curve assay in P. aeruginosa overexpressing either noxSp or FDH1Cb. Cells carrying the empty vector (EV) served as a control. The expression of each gene was induced with 0.1 mM IPTG, and the strains were grown until early exponential phase before the treatment with lethal concentrations of ceftazidime (A), tobramycin (B), amikacin (C), levofloxacin (D), or ciprofloxacin (E). Colony-forming units (CFU) counts were obtained from platting the cells at specific time points after antibiotic challenge and plotted as the log10 of the survival fraction. The average result of three independent experiments with their respective standard deviation is shown. CAZ, ceftazidime; TOB, tobramycin; AMK, amikacin; LEV, levofloxacin; CIP, ciprofloxacin. Statistical differences were calculated by the extra sum-of-squares F test from best-fit killing rate constants obtained by fitting the curves to nonlinear regression models, as explained in the methods. *, P < 0.05; ****, P < 0.0001.

