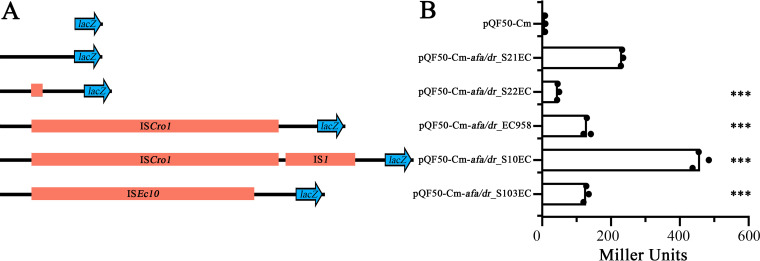
FIG 4.
(A) Schematic representation of the afa/dr promoter-lacZ fusion constructs used in this study. Shown are the different promoter regions cloned immediately upstream of the promoterless lacZ gene in pQF50-Cm. The black lines represent the promoter sequence, and the orange rectangles represent the insertion elements. (B) β-galactosidase assay showing the activity of the different afa/dr promoters. β-galactosidase activity is expressed as Miller units. Experiments were performed in three biological replicates. Unpaired Student's t test was used for statistical analysis (***, P value < 0.0001).

