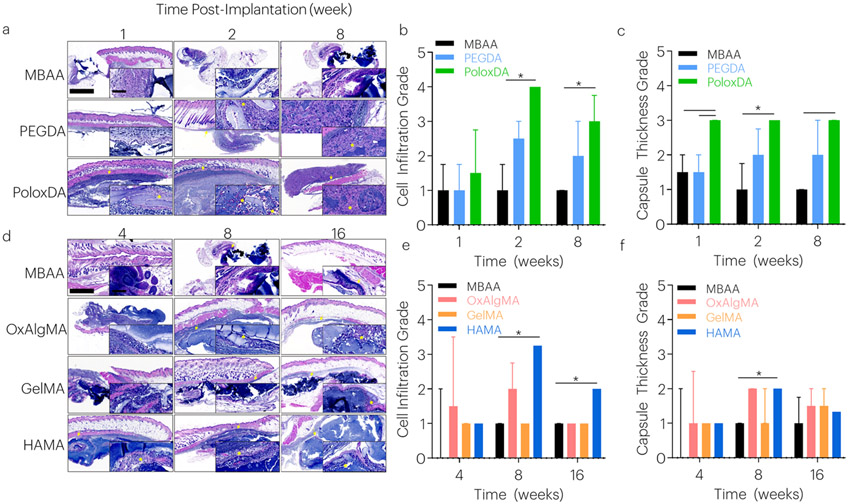
Figure 4: Tough Hydrogels with Degradable Covalent Network Demonstrate Biocompatibility.
Tissue histology samples were collected over time. (a-c) In fast degrading gels, cell infiltration and capsule thickness were evaluated after 1, 2, and 8 weeks. *P<0.025 between groups. Median values are shown, and error bars represent IQR. (n=3-4 samples/group), as analyzed by a Scheirer-Ray-Hare test (nonparametric 2-way ANOVA) with Dunn’s tests for multiple comparisons. Histological images are sagittal sections of tough hydrogel, surrounding soft tissue, and skin tissues stained with hematoxylin and eosin. Larger image scale bar: 1000μm. Inset scale bar: 100μm. The tough hydrogel stains dark blue with the basic hematoxylin; (blue) nuclei of leukocytes clustered at the periphery of the gel are also dark blue. Surrounding tissue, fibrous capsule, and subcutaneous muscle appear red with the acidic eosin component of the stain. Arrows indicate capsule. Asterisks indicate cell infiltration. (d-f) In slow degrading gels, cell infiltration and capsule thickness were evaluated after 4, 8, and 16 weeks. *P<0.017 between groups. Median values are shown and error bars represent IQR. (n=3-4 samples/group), as analyzed by a Scheirer-Ray-Hare test (nonparametric 2-way ANOVA) with Dunn’s tests for multiple comparisons. Histological images are sagittal sections of tough hydrogel, surrounding soft tissue, and skin tissues. Larger image scale bar: 1000μm. Inset scale bar: 100μm. The tough hydrogel stains dark blue with the basic hematoxylin; (blue) nuclei of leukocytes clustered at the periphery of the gel are also dark blue. Surrounding tissue, fibrous capsule, and subcutaneous muscle appear red with the acidic eosin component of the stain. Arrows indicate capsule. Asterisks indicate cell infiltration.

