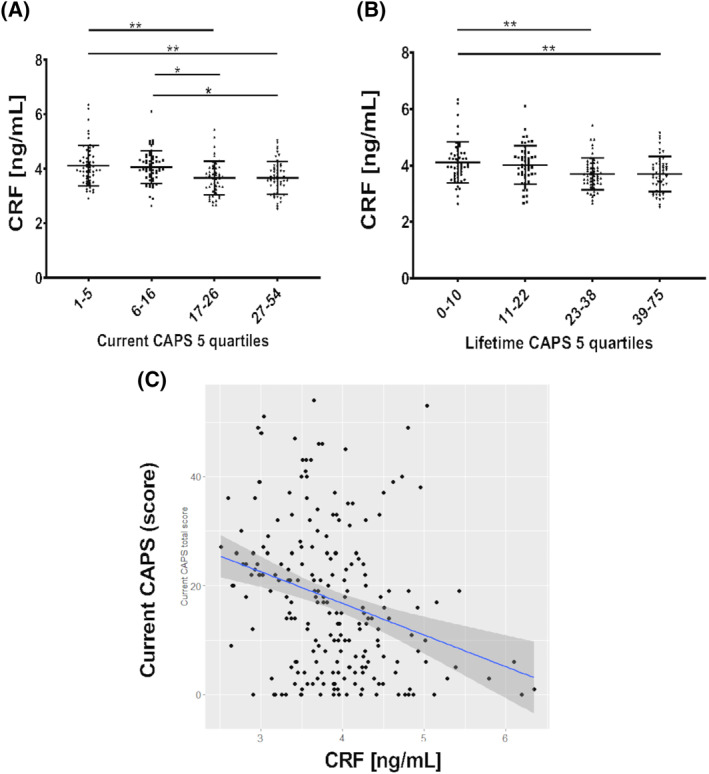
FIGURE 2.

Differences in CRF levels in subjects within quartiles of PTSD symptomatology (measured by clinician‐administered PTSD scale for DSM‐5 [CAPS‐5]). Similar reductions are observed for current (A) and lifetime CAPS‐5 evaluation (B) Each quartile comprises 25% of the participants with available CRF and CAPS measures (total subjects: N = 211 for both current caps and lifetime CAPS). Bars represent mean and standard deviation. * = p < 0.05; ** = p < 0.01 (ANOVA and Tukey's multiple comparison tests). (C) Correlation of current CAPS score with serum CRF in the whole study group is moderate (Spearman r = 0.31; p < 0.0001; Pearson r = −0.29; p < 0.0001). ANOVA, analysis of variance; CAPS, Clinically Administered PTSD Scale; CRF, corticotropin‐releasing factor; PTSD, posttraumatic stress disorder
