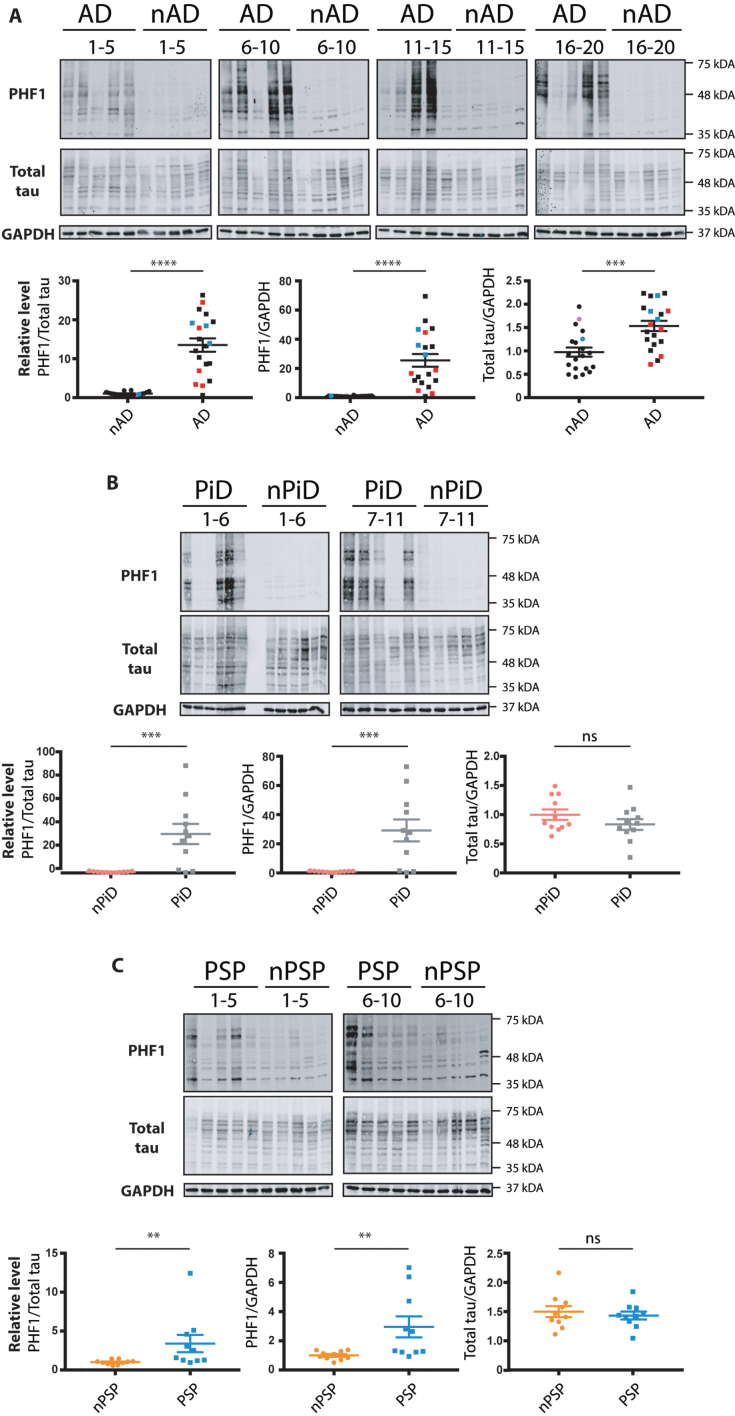
Fig. 1.
Relative levels of phospho-tau in the brain samples from distinct tauopathy cohorts. Brain homogenates from age-matched controls and (A) AD, (B) PiD, and (C) PSP brains were probed for p-tau, total tau and GAPDH. The PHF1 and total tau immunoreactivity is shown alongside the corresponding GAPDH. Immunoreactivity was expressed as ratios of PHF1/total tau, PHF1/GAPDH and total tau/GAPDH. The normalized data were analyzed using a one-tailed unpaired t-test (total tau/ GAPDH) or Mann-Whitney test (PHF1/ total tau, PHF1/ GAPDH). Shown is the mean, error bars are SEM. ****p≤0.0001; ***p≤0.001; **p≤0.01, ns- not significant. p-tau/GAPDH: AD: p < 0.0001 (U = 11), PiD: p = 0.0012 (U = 16), PSP: p = 0.0045 (U = 16); p-tau/total tau: AD: p < 0.0001 (U = 16), PiD: p = 0.0004 (U = 12), PSP: p = 0.001 (U = 11). Total tau/ GAPDH: AD: (p = 0.0002, t = 3.811, BF +0 = 69.957); PiD: (p = 0.1027, t = 1.309, BF +0 = 0.165); PSP: (p = 0.286, t = 0.5759, BF +0 = 0.356). Number of cases: ND = 20, AD = 20, nPiD = 11, PiD = 11, nPSP = 10, PSP = 10. Each lane corresponds to one individual case. Colored symbols in (A) correspond to individuals with LBD co-morbidity (red), APOE 4.4 genotype (blue), and CVD co-morbidity (magenta).

