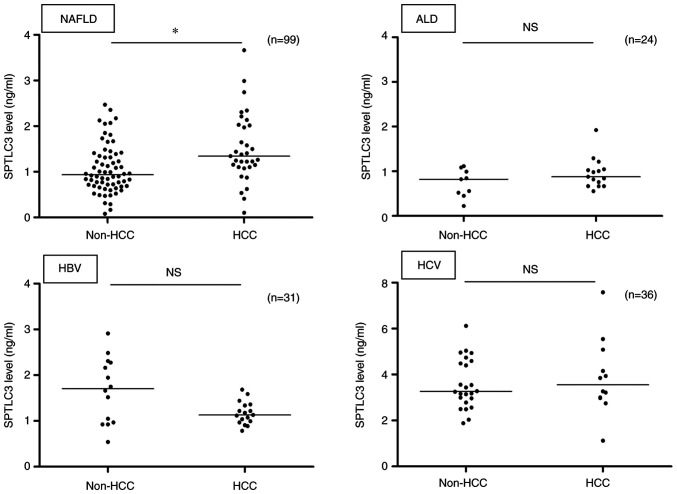
Figure 5.
Serum SPTLC3 levels of patients with liver disease of different etiologies without HCC vs. with HCC. The horizontal lines in the dot plot represents the medians. Statistical analyses were performed using the Mann-Whitney U test. *P=0.001, non-HCC vs. HCC. SPTLC3, serine palmitoyltransferase long chain subunit 3; NAFLD, non-alcoholic fatty liver disease; ALD, alcoholic liver disease; HBV, hepatitis B virus; HCV hepatitis C virus.

