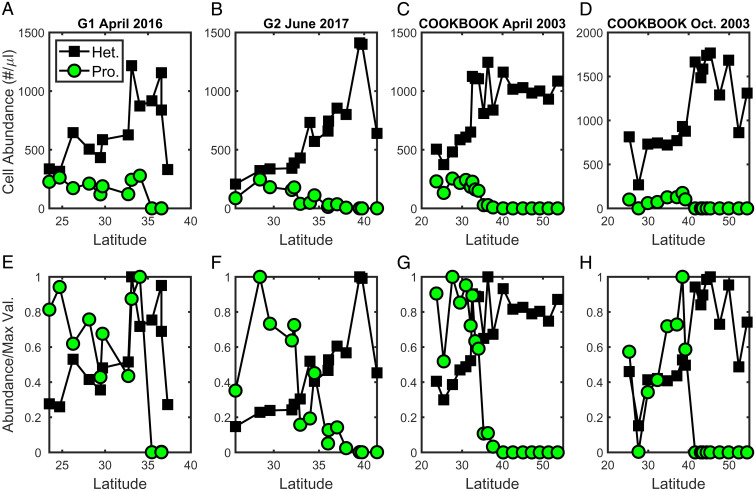
Fig. 5.
Observed surface data for Prochlorococcus (green circles) and heterotrophic bacteria (black squares). (A–D) Cell abundance (cells per microliter) across four different transects spanning 2003–2016. Cruises in B–D are the same as in Fig. 1. Additional cruise information is available for the SCOPE-Gradients cruises 1 and 2 (A and B; see ref. 7) and the COOK-BOOK cruises (C and D; see ref. 8). (E–H) Cell abundance normalized to the maximum value of that type on that transect (above, A–D).

