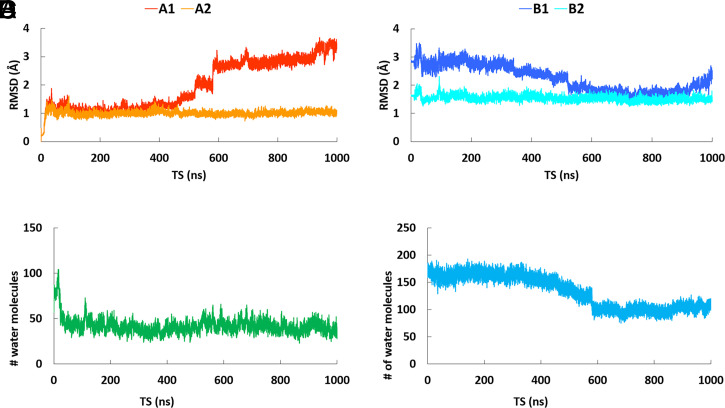
Fig. 6.
RMSD versus time of the simulation for the “open” conformation of Lp-PLA2 in the presence of water. (A, A1) The backbone atoms of Lp-PLA2 in the trajectory were aligned to the starting (“open”) conformation of the simulation (red color), (A, A2) same alignment as A1, but the peptide region 100 to 130 was excluded (orange color), (B, B1) The backbone atoms of Lp-PLA2 in the trajectory were aligned to the crystallographic conformation (PDB ID: 3D59, blue color), (B, B2) same alignment as B1, but the peptide region 100 to 130 was excluded (cyan color). (C) Number of water molecules in the active site of Lp-PLA2 versus time of the simulation in the presence of a membrane patch, and (D) number of water molecules in the active site of Lp-PLA2 versus time of the simulation in the presence of water.

