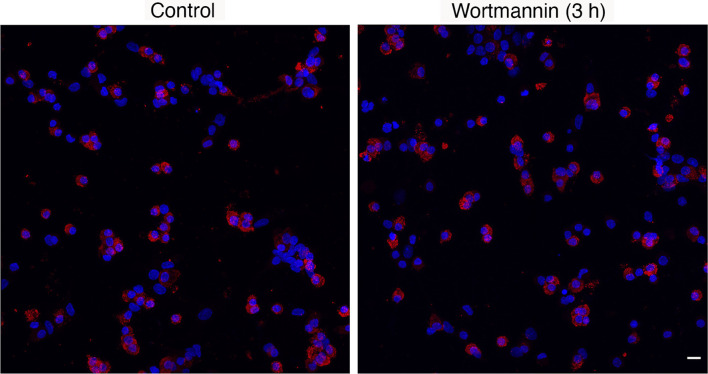
Figure 3.
Immunofluorescence analysis of prolactin protein expression in control and Wm (10 µM/3h)-treated pituitary cells. Red indicates prolactin-positive cells; blue indicates cell nuclei stained with DAPI. Scale bar applies to both images: 10 µM. The mean ± SEM values of the percentage of PRL-positive cells in controls was 33.7 ± 2.1 (n = 8) and in Wm-treated cultures was 32.1 ± 2.7 (n = 8).

