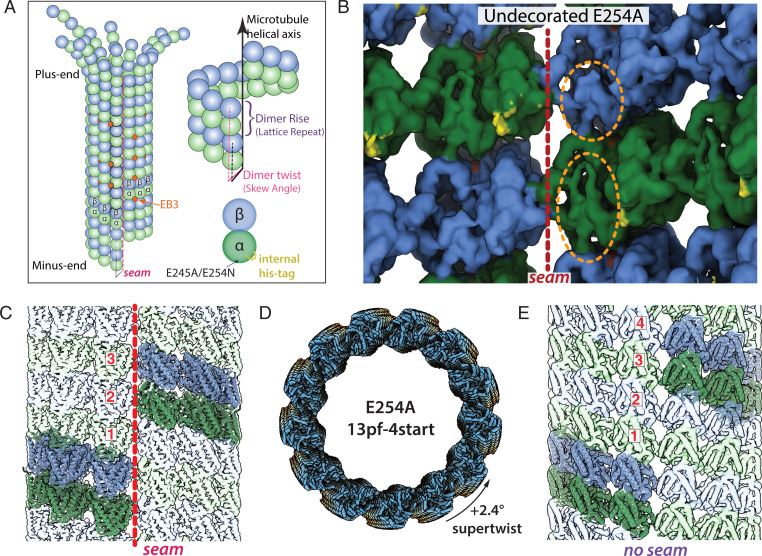
Fig. 1.
Structural characterization of E254A MTs. (A) Cartoon diagram of a 13-pf 3-start MT undergoing depolymerization, with α-tubulin in green, β-tubulin in blue, and EB3 in orange (colors maintained throughout). Also shown are the dimer rise and dimer twist (or skew angle) of the MT lattice, in which rise denotes the distance (in angstroms) from one tubulin dimer to the one directly above it, and twist is the angle around the MT helical axis that must occur going from one dimer to the one above. (B) View of tubulin dimers from the lumen, in which orange ovals highlight distinctive features of the α- and β-tubulin subunits, and the red dashed line denotes the seam for E254A MTs. The small region highlighted in yellow corresponds to additional density in the recombinant sample that can be assigned to the internal His6-tag. (C) A representative 13-pf 3-start MT (in this case, E254A at 3.4-Å resolution). The same generic architecture was observed for wt and E254N MTs (though with subtle differences in lattice parameters). (D) Subclassification of the 13-pf E254A dataset revealed a subset of 13-pf 4-start MTs, here shown colored blue-yellow-orange along the MT axis. (E) Lateral view of 13-pf 4-start MTs showing the absence of a seam in the MT lattice (map at 3.7 Å resolution). In C and E, one helical layer of tubulin dimers is highlighted and the corresponding ribbon diagrams docked into those dimers to emphasize the difference between the two lattices.

