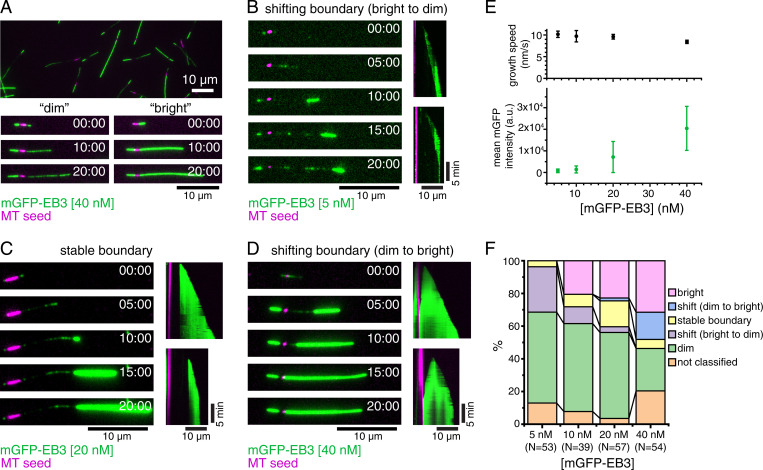
Fig. 2.
Dynamic E254N MTs observed by TIRF microscopy. (A) TIRF microscopy image of nonfluorescent E254N MTs after 20 min of growth from CF640R-labeled, GMPCPP-stabilized MT “seeds” (magenta) in the presence of 40 nM mGFP-EB3 (green) and GTP showing a variety of “dimly” and “brightly” mGFP-EB3-decorated MTs. (Bottom) Time series of growth of a “dim” and “bright” MT. (B–D) Time series and kymographs exemplifying MT growth behavior: (B) MT showing a switch from “dim” to “bright” lattice at the growing plus end, followed by progressive conversion of the lattice at the boundary to the “dim” state, causing the boundary to move toward the growing plus end (5 nM mGFP-EB3). (C) Once this MT switches into a “bright” binding state at the growing plus end, the boundary between the “dim” and the “bright” lattice does not change (20 nM mGFP-EB3). (D) Once this MT switches to the “bright” state, the “dim” lattice progressively switches at the boundary toward the seed, until the MT is entirely “bright” (40 nM mGFP-EB3). (E, Top) Mean E254N MT plus-end growth speed for the different mGFP-EB3 concentrations studied. Error bars represent SEs. The numbers of MTs and segments of constant speed used in the calculation for each mGFP-EB3 concentration are the folowing: 5 nM mGFP-EB3, 42 MTs, and 109 segments; 10 nM mGFP-EB3, 30 MTs, and 74 segments; 20 nM mGFP-EB3, 50 MTs, and 169 segments; and 40 nM mGFP-EB3, 42 MTs, and 124 segments). (Bottom) Mean fluorescence intensity of mGFP-EB3 binding to MTs for each mGFP-EB3 concentration. Error bars represent SDs. Intensity data are replotted in Fig. 3C. (F) Stacked bar chart of MT growth behavior at different mGFP-EB3 concentrations. mGFP-EB3 binding patterns were assessed manually by comparing to the other MTs in the same field of view. “Dim” and “bright” MTs showed relatively uniform binding throughout growth. Some MTs could not be clearly classified into any category. Only the parts of the MTs growing from the plus end of stabilized MT seeds were included in the analysis reported. N indicates the number of MTs considered for analysis from two different experimental replica (three for 20 nM mGFP-EB3). All experiments were performed with 12.5 µM E254N tubulin. (Scale bars, 10 µm for length and 5 min for time.)

