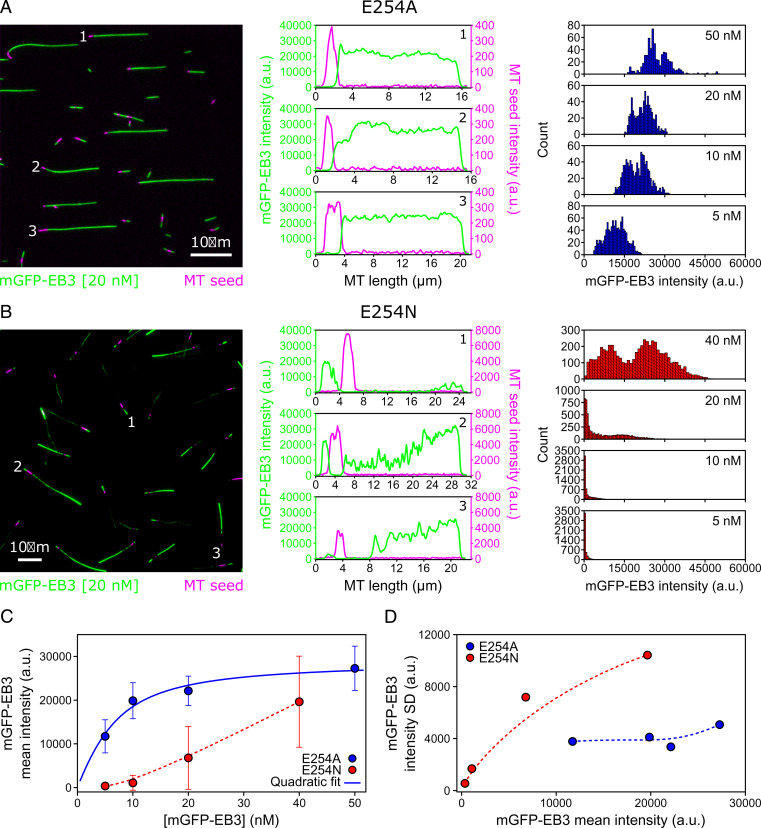
Fig. 3.
Quantitative comparison of mGFP-EB3 binding to E254A and E254N MTs as observed by TIRF microscopy. (A and B, Left) TIRF microscopy images of nonfluorescent E254A MTs (A) and E254N MTs (B) grown from CF640R-labeled, GMPCPP-stabilized “seeds” (magenta) in the presence of 20 nM mGFP-EB3 (green) and GTP. (Scale bars, 10 µm.) (Middle) Line profiles of mGFP-EB3 (green) and MT seed (magenta) intensities along the three MTs indicated in the images on the Left. (Right) Global mGFP-EB3 intensity distribution along several MTs at different mGFP-EB3 concentrations (E254A MTs: 5 nM mGFP-EB3, n = 18 MTs; 10 nM mGFP-EB3, n = 13 MTs; 20 nM mGFP-EB3, n = 10 MTs; and 50 nM mGFP-EB3, n = 11 MTs; E254N MTs: 5 nM mGFP-EB3, n = 35 MTs; 10 nM mGFP-EB3, n = 37 MTs; 20 nM mGFP-EB3, n = 43 MTs; and 40 nM mGFP-EB3, n = 38 MTs). (C) Mean intensity of mGFP-EB3 along E254A MTs (blue circles) and E254N MTs (red circles; same data as in Fig. 2 E, Bottom) as a function of mGFP-EB3 concentration. Error bars represent SDs. The solid blue line shows a quadratic fit through the E254A MT data, and the red dashed line is a Bezier interpolation used as guide-to-the-eye. (D) SD of mGFP-EB3 intensity along the MTs as a function of mGFP-EB3 mean intensity for E254A MTs (blue circles) and E254N MTs (red circles). Dashed lines are Bezier interpolations used as guide-to-the-eye.

