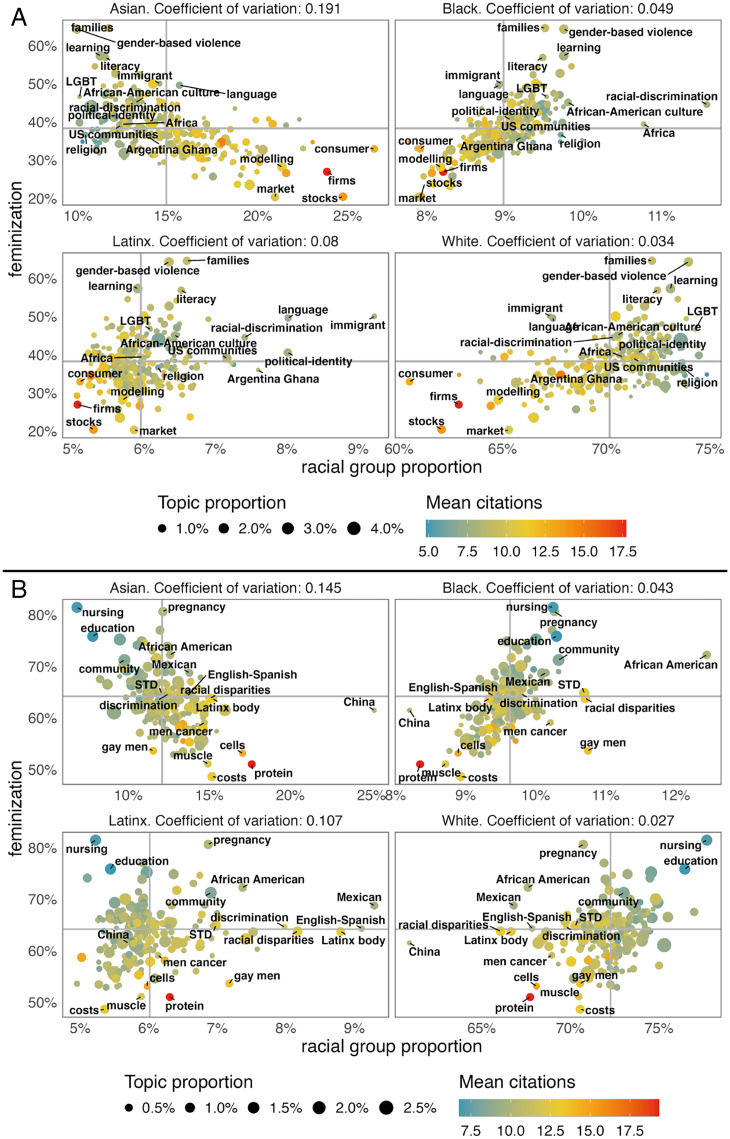
Fig. 2.
Distribution of topics by racial group and gender participation. (A) Social Sciences, Humanities, and Professional Fields, (B) Health. For Social Sciences, Humanities, and Professional Fields (n = 283,589 articles), we train an LDA model for 300 topics. For Health (n = 142,032), we train the LDA model for 200 topics. The vertical axis shows the proportion of women, while the horizontal axis shows the proportion by each racial group. In color, there is the mean number of citations by topic. The CV, as a standardized measure of variability, is provided for each racial group. Topics with the highest proportion in each race and in each gender are highlighted (labeled). Racial categories from the census corresponding to AIAN and two or more were excluded from the racial inference because of lack of data. Minimum number of average citations: 4.37, max. 15.74, and mean 9.25. STD, sexually transmitted disease.

