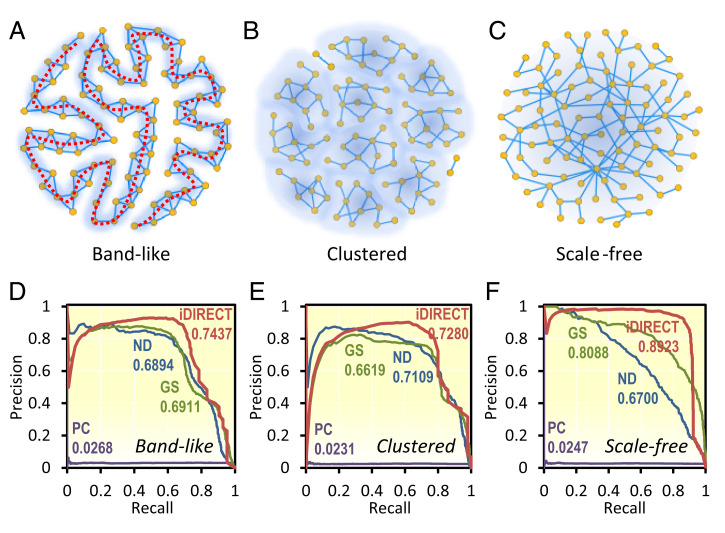
Fig. 2.
Performance of iDIRECT on simulated networks in comparison with other methods. (A–C) Synthetic networks with three distinct topologies. (A) Band-like. All the nodes are connected to form a long, band-like structure. The dotted red line indicates the band. (B) Clustered. All nodes are clustered into several disjointed groups. (C) Scale-free. The degree distribution of the nodes follows the power law. (D–F) Comparison of PR curves with varying network topologies: band-like (D), clustered (E), and scale-free (F). Pearson’s correlation coefficients were used to calculate the association matrix. Red, iDIRECT; blue, ND; green, GS; and purple, PC. The numbers indicate the AUPR, with values ranging from zero to one. AUPR represents the average precision when recall varies from zero to one.

