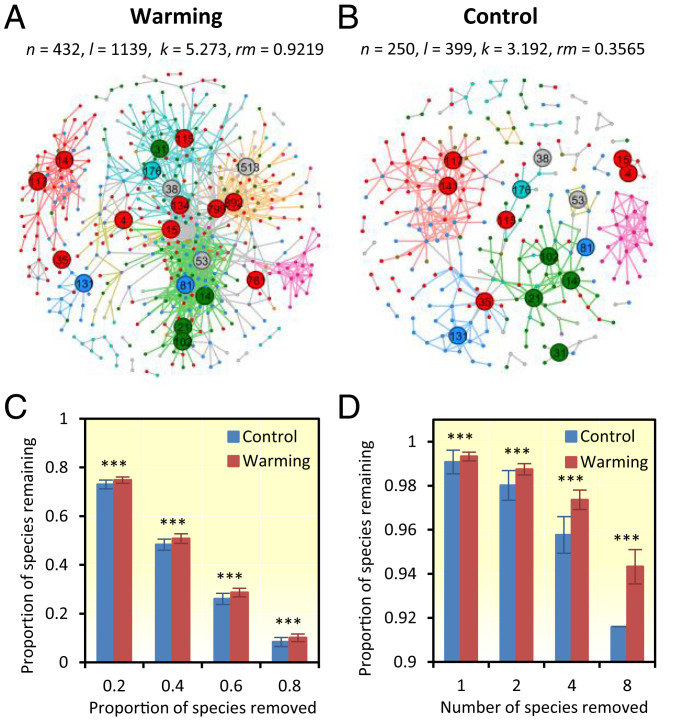
Fig. 4.
Soil microbial networks in response to experimental warming. (A and B) Visualization of the microbial MENs under warming or control. n, node number; m, edge number; k, average connectivity; rm, relative modularity. Network nodes were colored at the phylum level; edges were colored based on their module memberships. OTUs identified as module hubs or network hubs were labeled by numbers. (C) Robustness to species removal of iDIRECT-processed networks when 50% of the taxa were randomly removed. (D) Robustness to target taxa removal of iDIRECT-processed networks when four module hubs were removed. The error bars represent SD of 100 repetitions of each simulation. Significant differences are expressed. ***P < 0.001. Detailed simulation results of robustness for both original iDIRECT-processed networks were seen in SI Appendix, Fig. S11.

