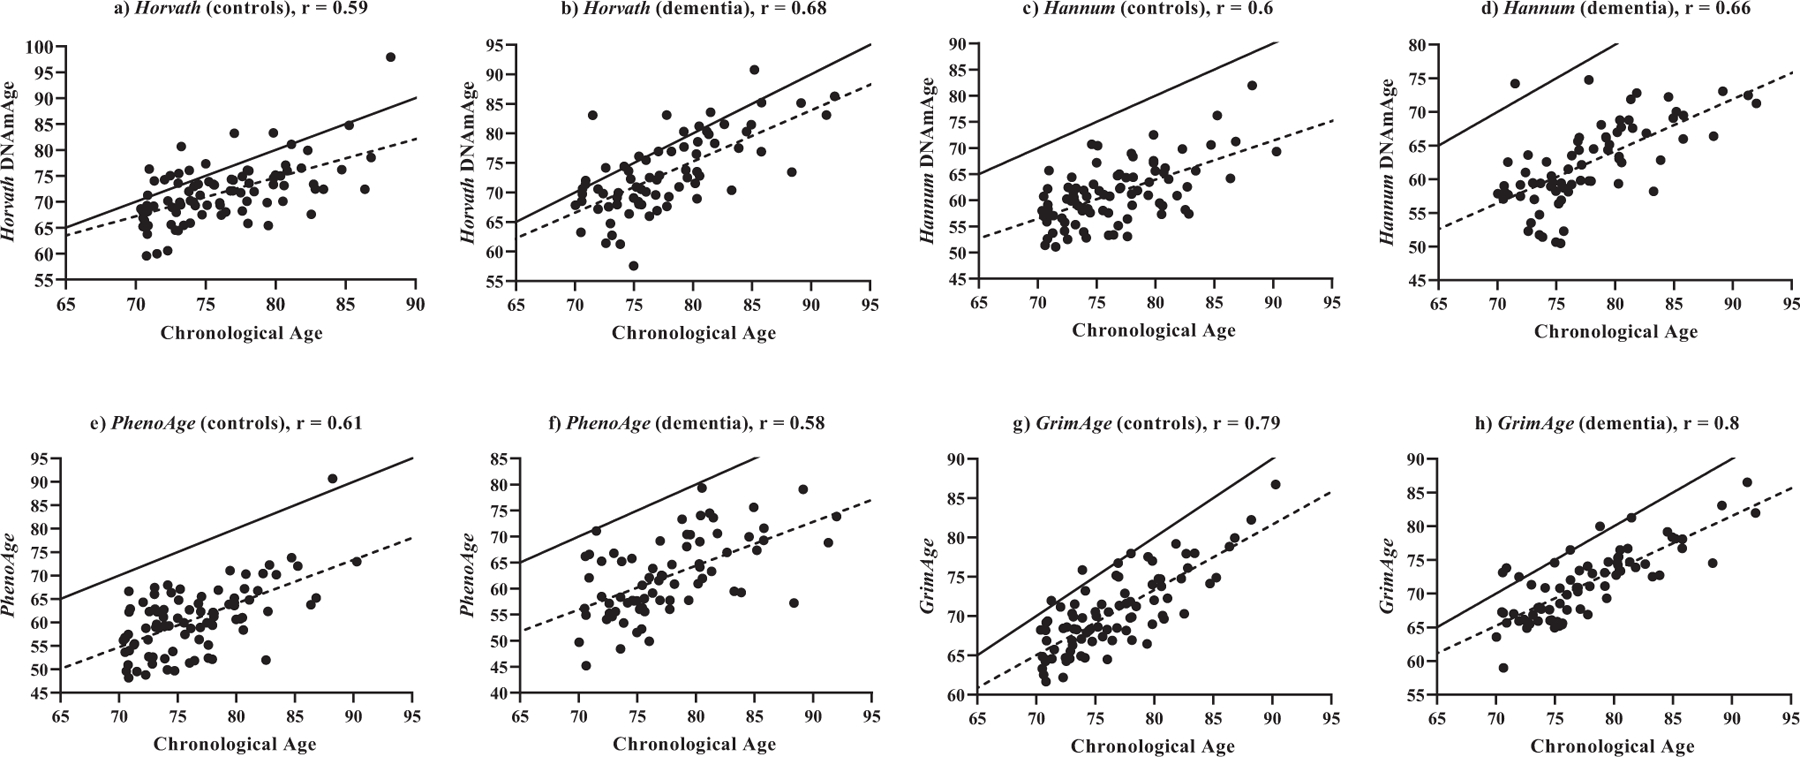
Fig. (1).

Correlations between estimated epigenetic age (y-axis) and chronological age (x-axis) at baseline. a) Horvath DNAmAge vs. chronological age in control participants (n = 87); b) Horvath DNAmAge vs. chronological age in dementia participants (n = 73); c) Hannum DNAmAge vs. chronological age in control participants (n = 87); d) Hannum DNAmAge vs. chronological age in dementia participants (n = 73); e) PhenoAge vs. chronological age in control participants (n = 87); f) PhenoAge vs. chronological age in dementia participants (n = 73); g) GrimAge vs. chronological age in control participants (n = 87); h) GrimAge vs. chronological age in dementia participants (n = 73); Solid line represents a perfect correlation between age and epigenetic age (r = 1), dotted line represents correlation between age and estimated epigenetic age. All correlations are p < 0.0001. (A higher resolution / colour version of this figure is available in the electronic copy of the article).
