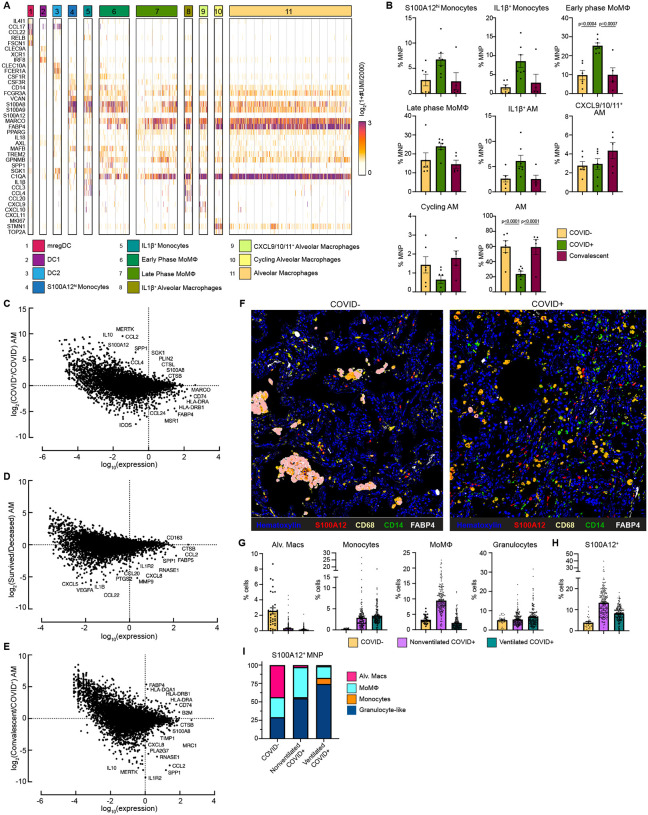
Figure 4: Alveolar Macrophage loss and phenotypic changes in the COVID-19 lung microenvironment.
(A) Heatmap showing UMI counts of selected genes from myeloid cell scRNAseq clusters from BAL. (B) scRNAseq cluster cell frequencies as % mononuclear phagocytes (MNP) in COVID−, COVID+, or convalescent patient BAL. Differential gene expression between (C) AM from COVID+ and COVID− patients, (D) AM from patients that survived vs deceased, (E) AM from convalescent and COVID+ patients. (F) Overlaid, pseudocolored MICSSS image of COVID+ and COVID− lungs, staining for S100A12, CD68, CD14, FABP4, and Hematoxylin. (G) Quantification of myeloid cells in MICSSS images, shown as % of cells. AM defined as FABP4+CD68+ cells; Monocytes defined as CD14+ cells; MoMΦ defined as CD14+CD68+ cells; Granulocyte-like cells defined as CD66b+ cells or by hematoxylin staining and morphology. (H) Quantification of S100A12+ cells in MICSSS images, shown as % cells in COVID− patient (n=1), nonventilated COVID+ patients (n=2), or ventilated COVID+ patients (n=2). (I) Distribution of S100A12+ cells by cell type in COVID−, nonventilated, or ventilated COVID+ lungs. For bar graphs, each dot represents patient sample (B) or quantification of single MICSSS region of interest (ROI) (G-H). Statistical significance (B) determined by 2-way ANOVA with Holm-Sidak multiple comparisons correction. Adjusted p-values shown.

