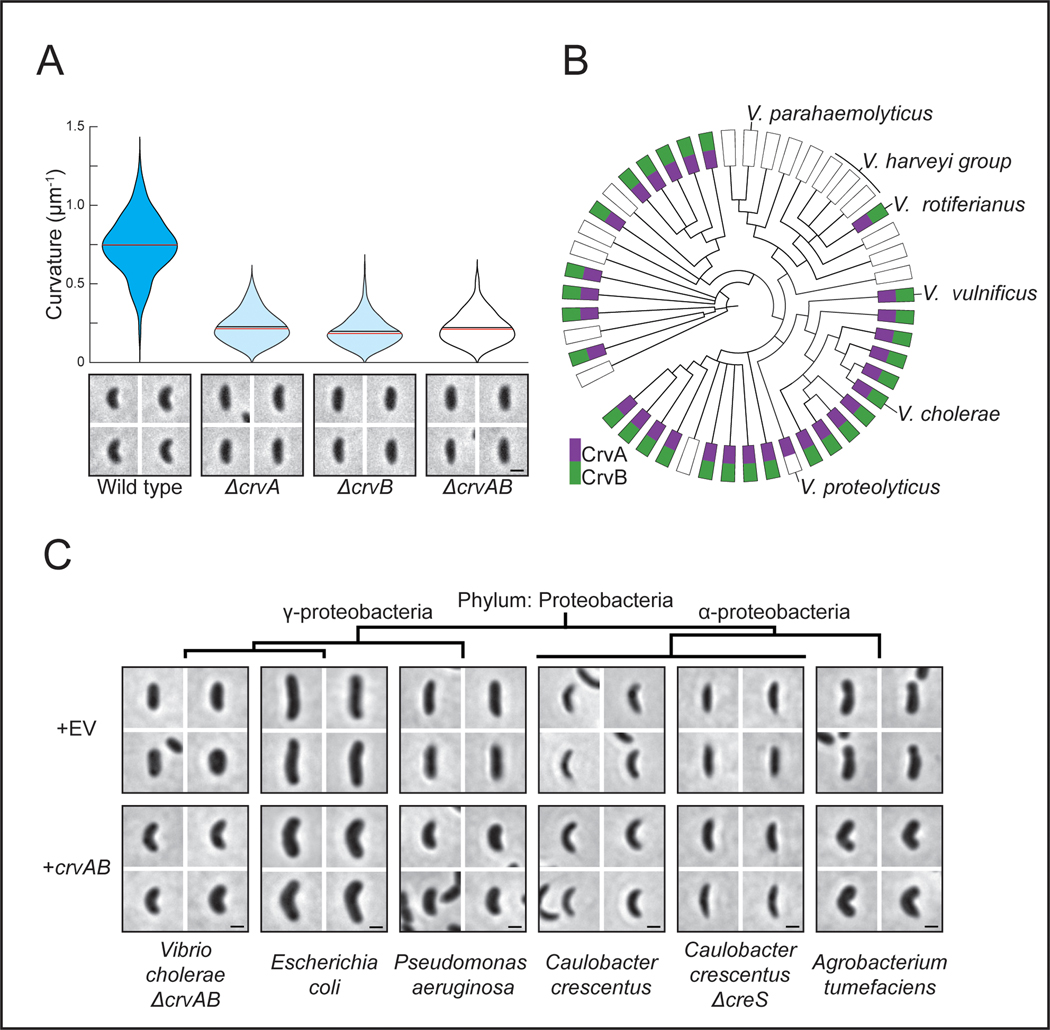
Figure 1. CrvA and CrvB curve bacterial cells.
(A) Quantified curvature of populations from indicated V. cholerae strains. Horizontal bars represent mean (black) and median (red). (B) Presence of CrvA and CrvB homologs across Vibrio species. Clade structure drawn according to framework outlined in 41. (C) Heterologous expression of crvA and crvB (+crvAB) or empty vector (+EV). Brackets indicate phylogenetic relationships between species Median curvature of +crvAB is significantly higher than +EV in each species (p≤3.74×10⁻⁵); two-sided Wilcoxon rank sum test, n=300 from three biological replicates (see Extended Data Figure 2 for quantified populations). (A,C) Single-cell curvature measured using Morphometrics 10. Images represent 95th percentile of curvature in respective populations. Scale bars are 1μm and images within each figure panel are to scale.

