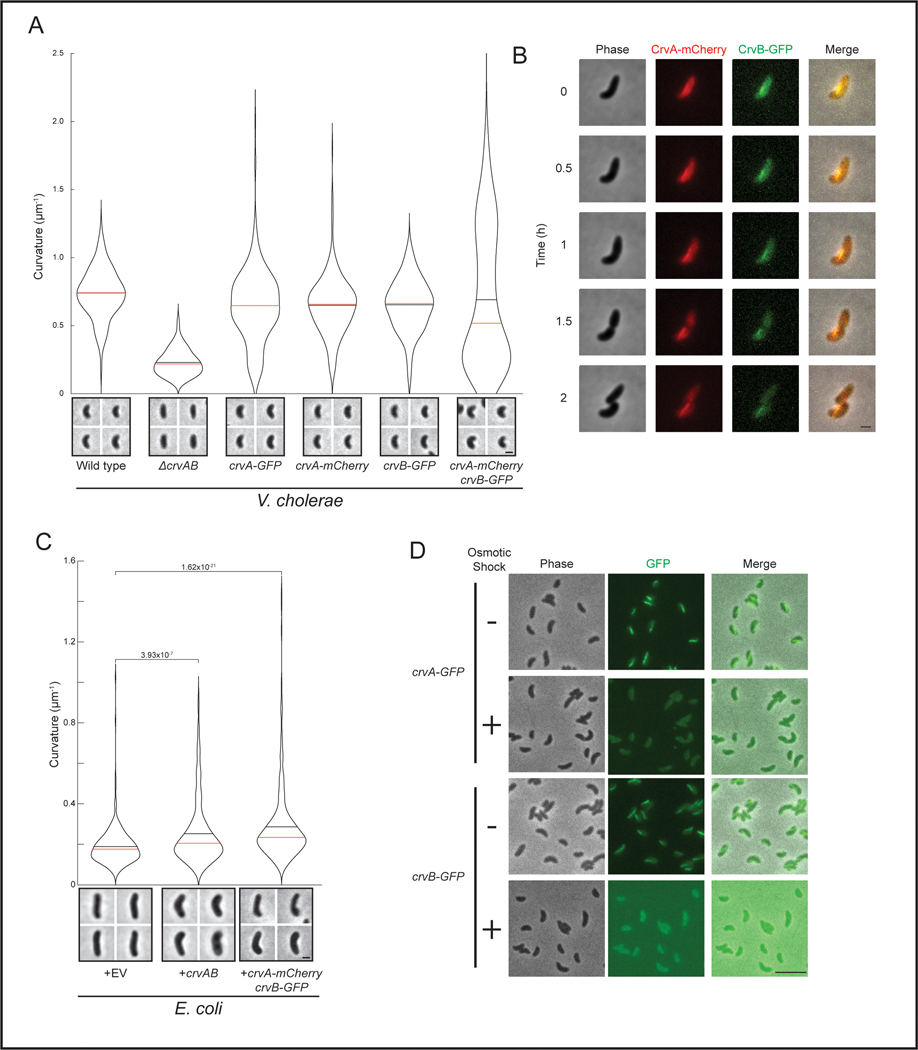
Extended Data Fig. 4. Functionality, time lapse, and osmotic dissociation of fluorescent CrvA and CrvB fusions.
(A) Quantified curvature of populations of V. cholerae expressing the indicated fusion proteins from the native genomic locus. Data from wild type and ΔcrvAB are repeated from Figure 1A. (B) Time lapse images of CrvB-GFP and CrvA-mCherry structures in growing V. cholerae. See Movie S1 for full time lapse. (C) Quantified curvature of E. coli populations expressing an empty vector (+EV), a plasmid with crvA and crvB (+crvAB), or the same plasmid with crvA-mCherry and crvB-GFP. Data from +EV and +crvAB are repeated from Figure 1C. (D) Osmotic shock of V. cholerae expressing crvA-GFP or crvB-GFP. (A,C) Images were taken 6h after dilution of saturated overnight cultures. Images represent 95th percentile of curvature in respective populations. (C) p-values from two-sided Wilcoxon rank sum test; n=300 from three biological replicates. Scale bars are 1μm in A-C and 5μm in D; images within each figure panel are to scale.

