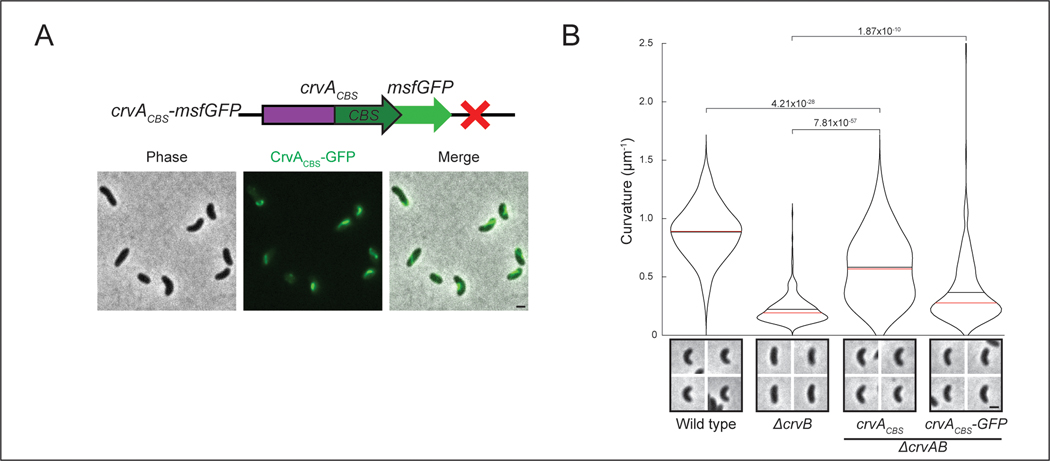
Extended Data Fig. 5. Quantification and localization of crvACBS in V. cholerae.
(A) Schematic of crv locus and representative image of cells expressing the crvACBS chimera tagged with msfGFP (CrvACBS-GFP).((B) Quantified curvature of populations from overnight cultures of indicated V. cholerae strains. Data from wild-type, ΔcrvB, and crvACBS are repeated from Figure 4. p-values from two-sided Wilcoxon rank sum test; n=300 from three biological replicates.Scale bars are 1μm; images within each figure panel are to scale

