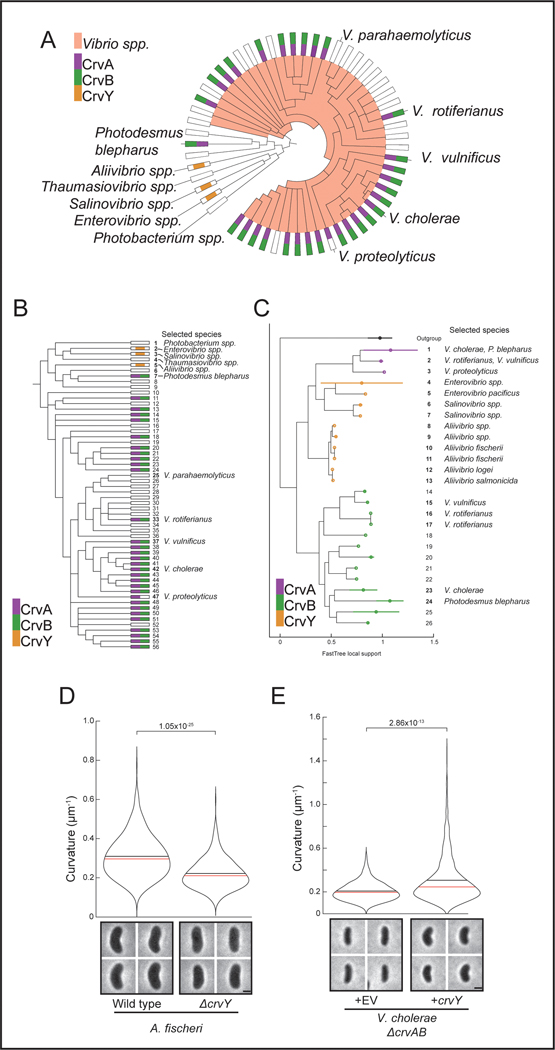
Extended Data Fig. 6. The evolution of CrvA/B/Y and functional study of CrvY.
(A) Extended cladogram from Figure 1B. (B) Linear form of extended cladogram in A. (C) Phylogeny of all sequenced CrvA, CrvB, and CrvY homologs. (D) Curvature of populations of wild-type A. fischeri or ΔcrvY. (E) Curvature of populations of V. cholera ΔcrvAB expressing an empty vector (+EV) or a plasmid with crvY from A. fischeri (+crvY). (A,B) Numbers are “Clade IDs” for reference to Table S2, which contains full composition of terminal nodes. (D) Terminal nodes are placed at the mean ± standard deviation of the sequences collapsed into each node. (D,E) Images represent 95th percentile of curvature in respective populations. Scale bars are 1μm; images within each figure panel are to scale. p-values determined by two-sided Wilcoxon rank sum test; n=300 from three biological replicates.

