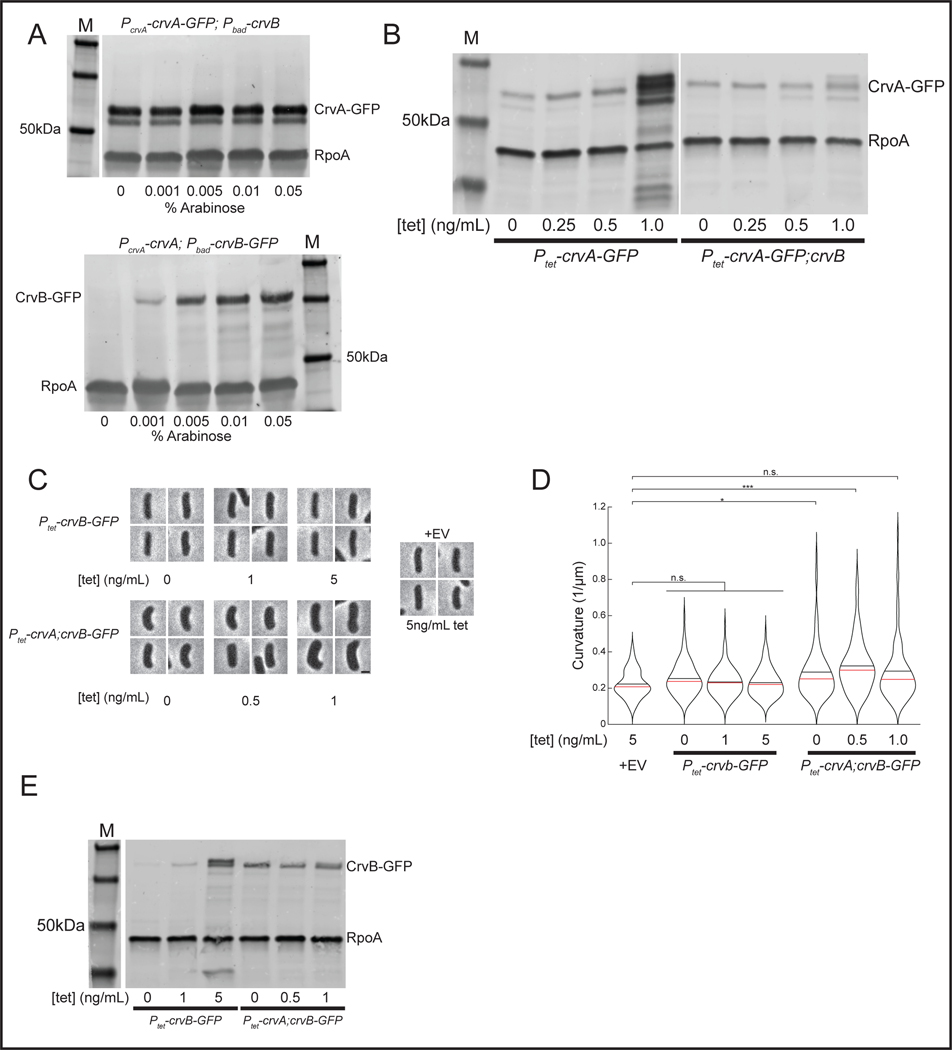
Extended Data Figure 7. Comparison of CrvA and CrvB concentrations under inducible expression.
(A) Western blots of CrvA-GFP (top) and CrvB-GFP (bottom) quantified in Figure 5E with molecular weight standards (M). Separate molecular weight standard in top panel is from the same blot as samples to right. Representative of three biological replicates with similar results. (B) Western blots of crvA-GFP and crvA-GFP;crvB overexpression from Figure 6A-B with molecular weight standard (M). Separate left and right panels are from the same blot. Representative of two biological replicates with similar results. (C) Representative images from anydrotetracycline (tet) overexpression of CrvA and CrvB-GFP in E. coli. Scale bar is 1μm; all images are to scale. (D) Quantification of curvature from populations in C. n.s.=confidence <95%; *=confidence >95%; **=confidence >99%; ***=confidence >99.9% (see Table S3 for exact p-values); two-sided Wilcoxon rank sum test with Bonferroni correction; n=100 from two biological replicates. (E) Western blot of crvB-GFP and crvA;crvB-GFP overexpression from (C). Separate molecular weight standard (M) and right panel are from the same blot. Representative of two biological replicates with similar results.

