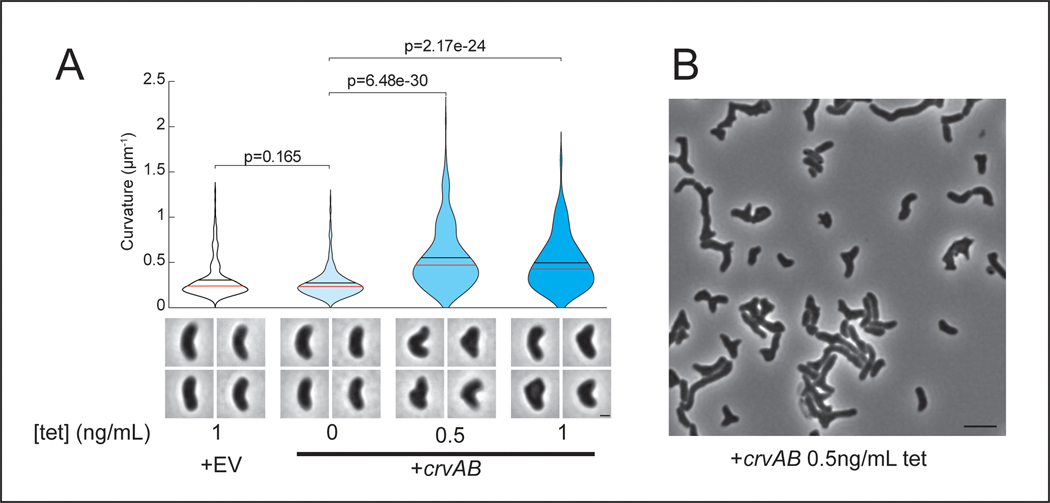
Extended Data Fig. 8. CrvAB overexpression drives early curvature.
(A) Curvature and representative images of populations overexpressing CrvA and CrvB two hours after back-dilution into media containing anhydrotetracycline. (B) Phase contrast image from A showing the extreme range of curvatures upon overexpression that are not captured by our quantitative analysis. (A) p-values calculated from two-sided Wilcoxon rank sum test; n=300 from three biological replicates. Scale bars are 1μm in A and 5μm in B; images within each figure panel are to scale.

