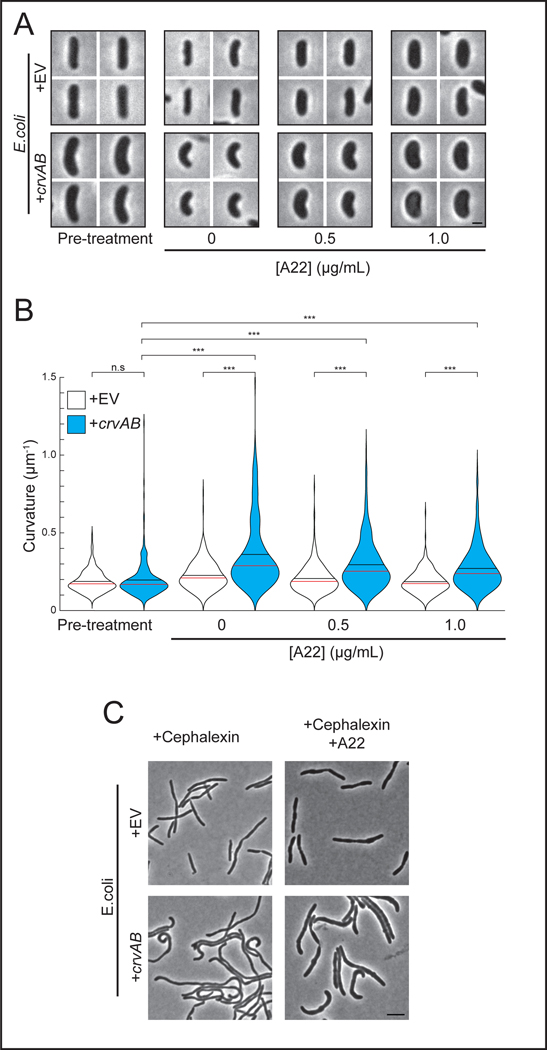
Figure 2. CrvA and CrvB curve E. coli despite inhibition of core machinery.
(A) E. coli expressing crvA and crvB (+crvAB) or empty vector (+EV) before (Pre-treatment) and after treatment with the elongasome inhibitor, A22. Scale bar is 1μm and all images are to scale.
(B) Quantified cell curvatures of A22-treated populations in A. Two-sided Wilcoxon rank sum test with Bonferroni correction; n=300 from three biological replicates. n.s.= confidence <95%; *= confidence >95%; **= confidence >99%; ***= confidence >99.9% (see Supplementary Table 3 for exact p-values). (C) E. coli after treatment with A22 and the divisome inhibitor, cephalexin. Scale bar is 5μm; all images are to scale. Representative of two biological replicates with similar results. (A) Images represent 95th percentile of curvature in respective populations.

