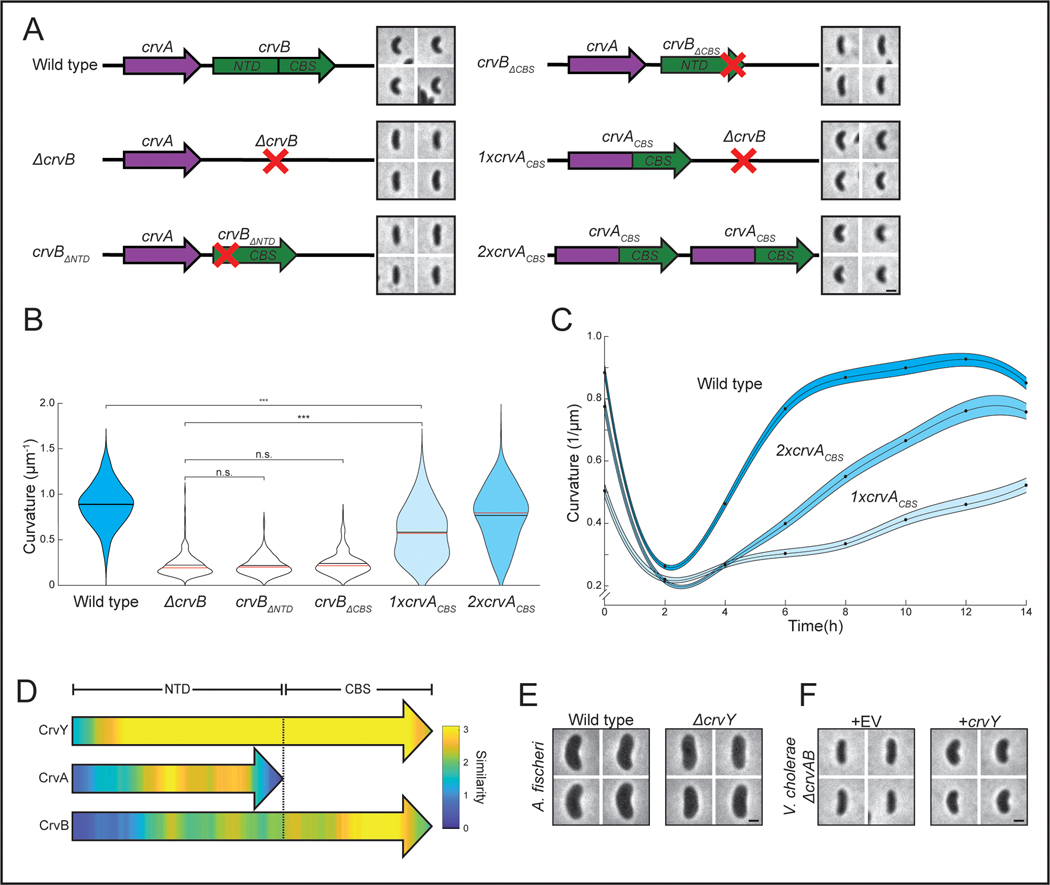
Figure 4. CrvA and CrvB induce curvature more rapidly than the sum of their parts.
(A) Schematic of the crvAB locus in crvB truncation mutants and crvACBS chimeras with representative images from saturated overnight cultures. (B) Quantified cell curvatures from populations of indicated strains from A. (C) Dynamics of mean cell curvature (±bootstrapped 95% confidence intervals) after 1000-fold dilution from saturated overnight cultures of wild type (WT) and strains expressing one (1xcrvACBS) or two (2xcrvACBS) copies of crvACBS. For each point, n=431–647 from three biological replicates. (D) Pairwise sequence alignment of all sequenced CrvA, CrvB, and CrvY homologs to CrvY. Sequence alignment and local similarity using the BLOSUM80 scoring matrix. (E) Morphology of A. fischeri ΔcrvY mutant. (F) Morphology of V. cholerae ΔcrvAB expressing crvY. (A,B) crvACBS overnight culture is the 0h time point from C (B) n.s.=confidence <95%; *=confidence >95%; **=confidence >99%; ***=confidence >99.9% (see Supplementary Table 3 for exact p-values); two-sided Wilcoxon rank sum test with Bonferroni correction; n=300 from three biological replicates. (A,E,F) Images represent 95th percentile of curvature in respective populations. Scale bars are 1μm; images within each figure panel are to scale. (E,F) See Extended Data Figure 3 for population measurements.

