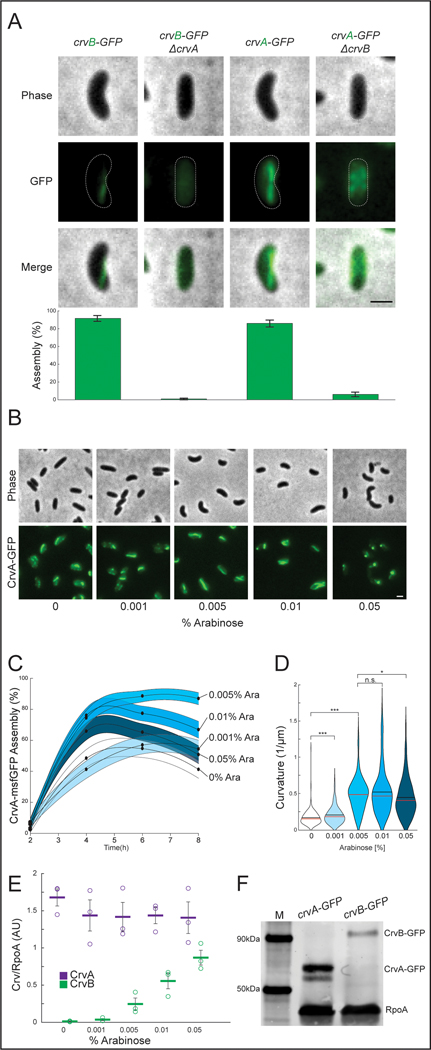
Figure. 5. CrvA and CrvB synergize to promote filament assembly in V. cholerae.
(A) CrvA-GFP and CrvB-GFP filament assembly in deletion mutants. (top) Representative cells (bottom) Quantification of assembly. Agresti-Coull estimate of percent of population with fluorescent filament similar to those in the wild-type background and its 95% confidence interval. n=300 from three biological replicates. Samples taken from cultures 6h after dilution from saturated overnight cultures. (B) Representative fields after induction of Pbad-crvB. (C) Dynamics of Agresti-Coull estimate of percent of population with assembled CrvA-GFP structures and its 95% confidence interval. n=300 from three biological replicates. (D) End point curvature measurements from B. n.s.=confidence <95%; *=confidence >95%; **=confidence >99%; ***=confidence >99.9% (see Supplementary Table 3 for exact p-values); two-sided Wilcoxon rank sum test with Bonferroni correction; n=300 from three biological replicates. (E) CrvA-GFP or CrvB-GFP levels during induction of Pbad in B-D quantified by western blot. Mean signal in arbitrary units normalized to RpoA loading control ± SEM; n=3 from three biological replicates. (F) Western blot of CrvA-GFP and CrvB-GFP under native regulation and molecular weight standard (M). Representative of three biological replicates with similar results. (E) Horizontal lines represent mean ± standard error of three biological replicates. (A-B) Scale bars are 1μm; images within each figure panel are to scale.

