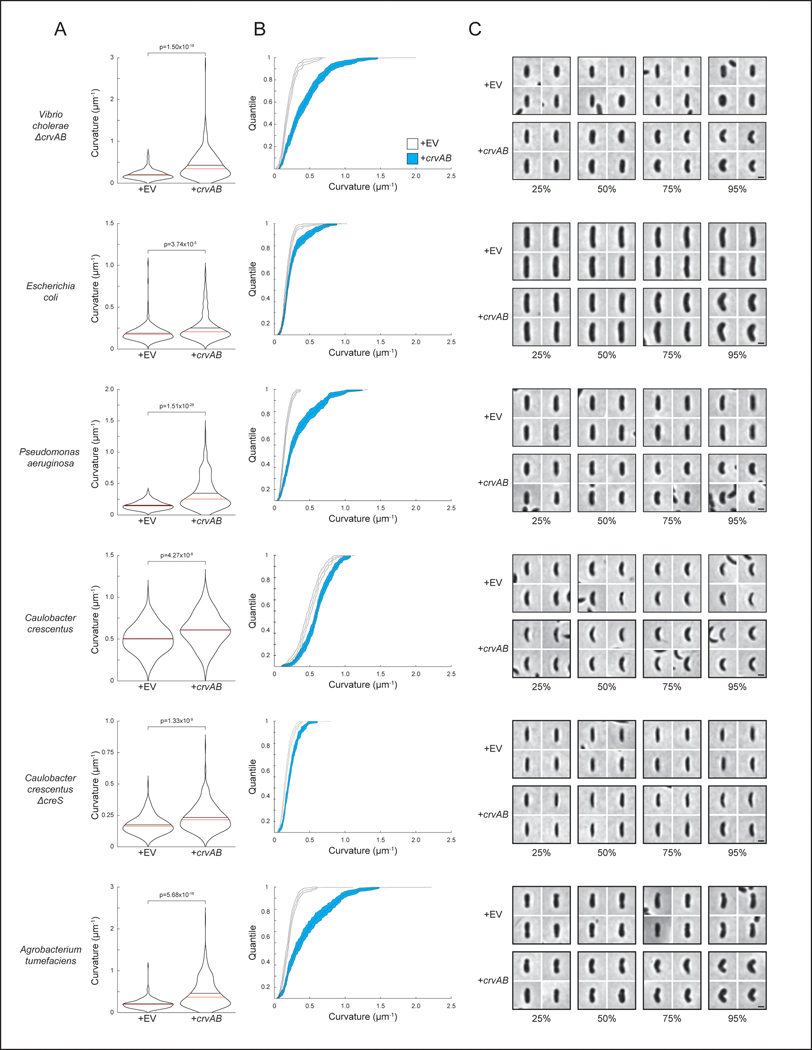
Extended Data Fig. 2. Quantification of heterologous CrvAB expression.
A) Curvature of populations expressing an empty vector (+EV) or a plasmid with crvA and crvB (+crvAB). p-values determined by two-sided Wilcoxon rank sum test; n=300 from three biological replicates. (B(B) Cumulative distribution functions of populations in A ± bootstrapped 95% confidence intervals. (C) Images represent indicated quantiles from populations in A.. Each row corresponds to the species labeled to the left of A. Scale bars are 1μm; images within each species are to scale. (A) The crvA and crvB open reading frames drawn to scale at the native locus in V. cholerae. (B) Alignment of V. cholerae CrvB amino acid sequence to V. cholerae CrvA by Clustalω 49. (C-E) Curvature of (C) ΔcrvA, (D) ΔcrvB, or (E) ΔcrvAB populations expressing an empty vector (EV) or plasmids with the indicated gene(s). (C-E) Images represent 95th percentile of curvature in respective populations. Scale bars are 1μm; images within each figure panel are to scale. p-values determined by two-sided Wilcoxon rank sum test; n=300 from three biological replicates.

