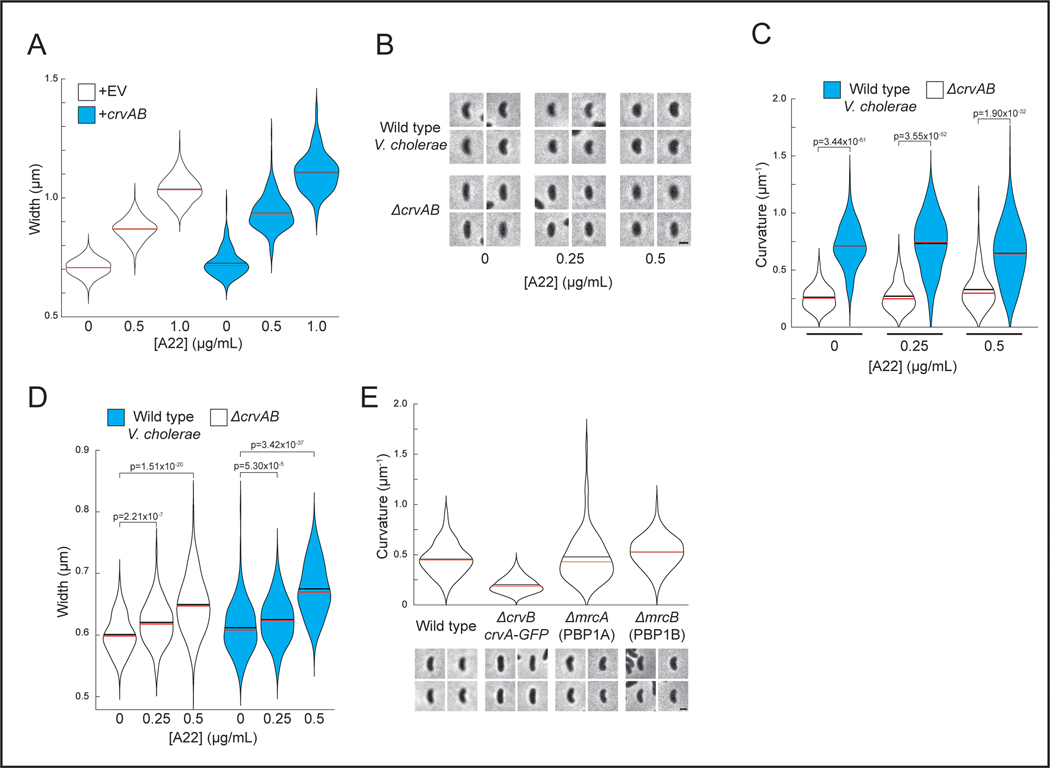
Extended Data Fig. 3. Morphology of E. coli and V. cholerae after inhibition of PG synthesis machinery.
(A) Quantified cell widths of A22-treated populations of E. coli from Figure 2A. (B) Representative images of wild-type and ΔcrvAB V. cholerae after growth with the elongasome inhibitor, A22. (C) Quantification of curvature from populations in B. (D) Quantification of cell width from populations in B. (E) Population curvature and representative images of indicated V. cholerae strains. n=300 from three biological replicates. (B, E) Images represent 95th percentile of curvature in respective populations. (C,D) p-values from two-sided Wilcoxon rank sum test; n=200 from two biological replicates. Scale bars are 1μm; images within each figure panel are to scale.

