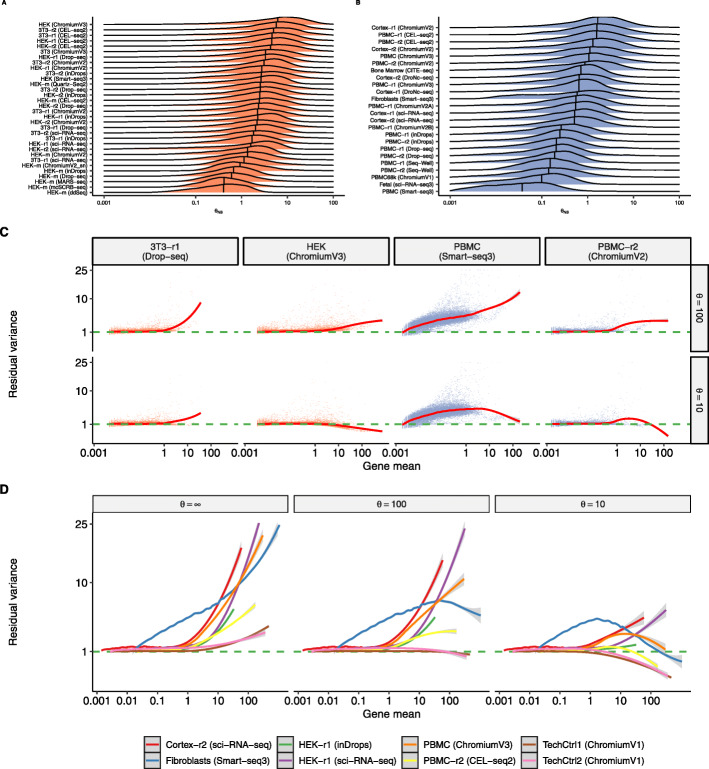
Fig. 2.
Overdispersion varies across datasets. A, B Distribution of per-gene values for the estimated inverse overdispersion θNB of a NB GLM across a range of cell lines (A) and heterogeneous datasets (B). We estimated parameters only for genes where the variance of counts exceeds the mean. Vertical bar indicates the median of the distribution, which varies substantially across datasets, but is concordant across replicate experiments within the same study. C Relationship between gene mean and the variance of Pearson residuals resulting from an NB GLM with θ=10 or θ=100. Each dot is a gene and the trendline (LOESS) is shown in red. D Same as (C), but shown for additional datasets and for θ=∞ (Poisson). Only trendlines are shown for visual clarity

