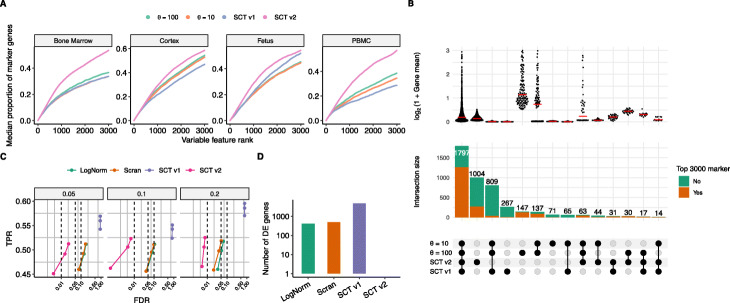
Fig. 4.
Benchmarking on variable feature selection and differential expression analysis. A Proportion overlap (median) of cluster marker genes and identified variable features using fixed θ={100,10}, sctransform v1, and sctransform v2. Marker genes were identified using presto [65], based on unsupervised clustering of log normalized data. Additional plots are shown in Additional file 1: Figure S22. B Comparison of variable features selected by θ={100,10} and our v1 and v2 regularization procedure on a PBMC (ChromiumV3) dataset. The bottom sub-panel represents the top 3000 variable genes identified by four different methods, and groups genes into categories based on the methods where they were identified. Top sub-panel shows the distribution of logarithmic gene mean within each category, with the median value marked in red. Middle sub-panel shows the number of genes within each category, and their overlap with cluster markers. C Benchmarking differential expression analysis. Observed overall true-positive rate (TPR) and false discovery rate (FDR) values for DE genes at FDR cutoffs of 1%, 5%, and 10% using a Wilcoxon rank-sum test (Additional DE methods are indicated in Additional file 1: Figure S23). Dashed vertical lines indicate desired FDRs. Methods that control FDR at their desired level should fall to the left of the corresponding dashed line. Performances were averaged across three simulation replicates. Data was simulated with muscat [79] using three annotated cell types (CD4 T, monocytes, and natural killer cells) from a Smart-seq3 and a Drop-seq PBMC dataset. Titles indicate simulated proportion of DE genes. D Number of differentially expressed genes identified between two groups of biological identical NK cells (PBMC Smart-seq3) where one group was randomly downsampled to 20% sequencing depth. Additional DE methods are indicated in Additional file 1: Figure S24. SCT = sctransform; LogNorm = standard log-normalization

