Figure 1.
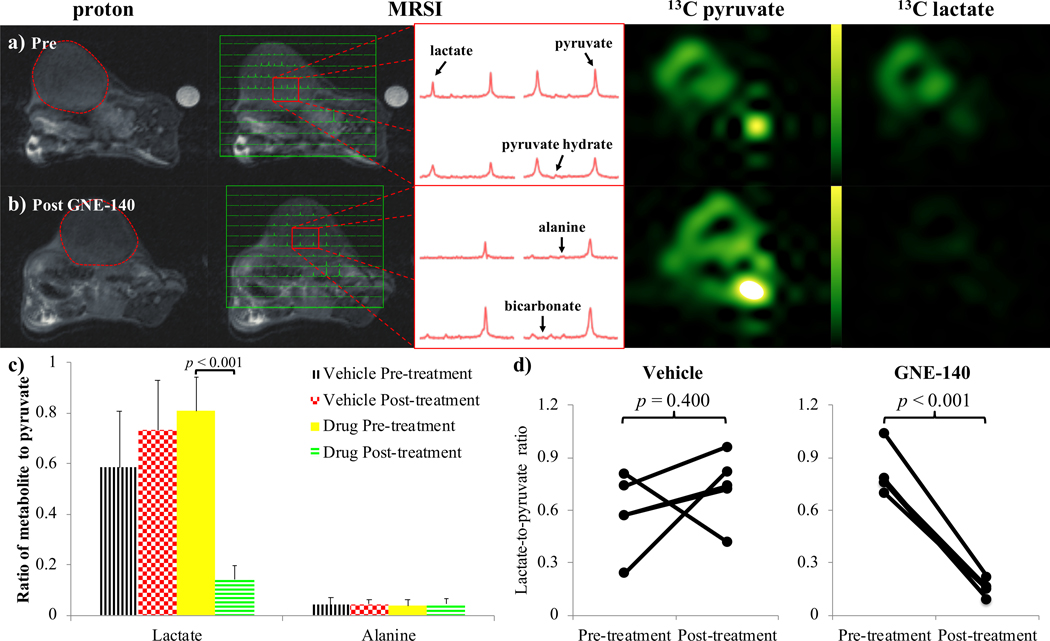
Images acquired in a model of triple-negative BRCA1-related breast cancer, a) before, and b) after administration of GNE140. From the left: proton; 13C MRSI voxels overlaid onto proton; representative 13C spectra from the tumor; pyruvate; and lactate, images. Pyruvate and lactate images from the same 13C MRSI acquisition are displayed on the same scale. The expected location of the bicarbonate signal (aliased due to the spectral width of the MRSI acquisition) is indicated in the lower right spectrum of the bottom center panel. c) Column plot of the ratio of lactate and alanine peaks to pyruvate peaks integrated over the 13C MRSI data acquisition. Values and error bars represent the mean and standard deviation calculated over the breast cancer model mice in each group (i.e. n=5) respectively. Brackets highlight p-values from paired two-tailed Student’s t-tests of the results pre- and post- treatment with the drug GNE140 and DMSO or the vehicle DMSO only. d) Scatter plots showing the lactate-to-pyruvate ratios in the breast cancer model before and after administration of vehicle (left) and GNE140 (right).

