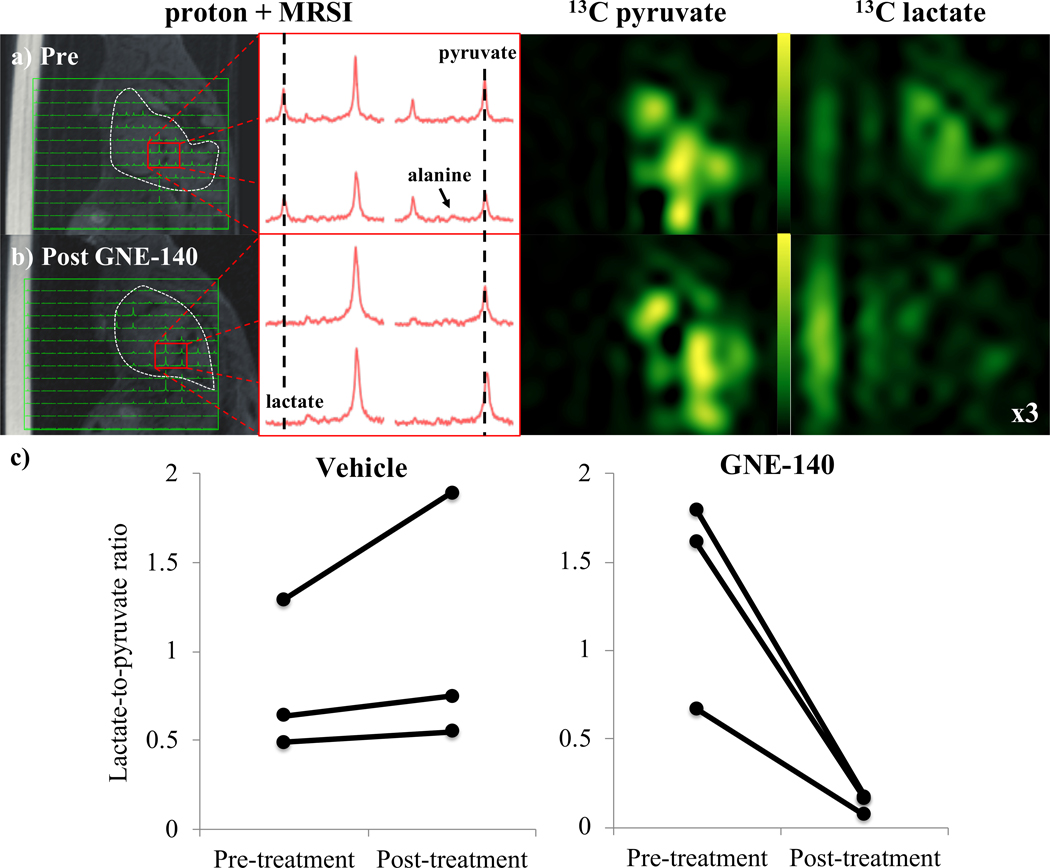
Figure 2.
Images acquired in a model of lung cancer, a) before, and b) after administration of GNE140. From the left: 13C MRSI voxels overlaid onto proton; representative 13C spectra from the tumor; pyruvate; and lactate, images. A vial of acetate used for reference (located approximately 50Hz from lactate in 13C spectra) appears in proton and lactate images to the left of the mouse. The signal intensity in the lactate image from 13C MRSI post administration of the LDH inhibitor is multiplied by 3 (relative to signal in the pyruvate image) to highlight the absence of lactate signal. c) Scatter plots show the change in lactate-to-pyruvate ratios from hyperpolarized 13C MRSI in the EFGR-driven lung cancer tumors before and after administration of vehicle (left) and GNE140 (right). N=3 for both control and treated groups.

