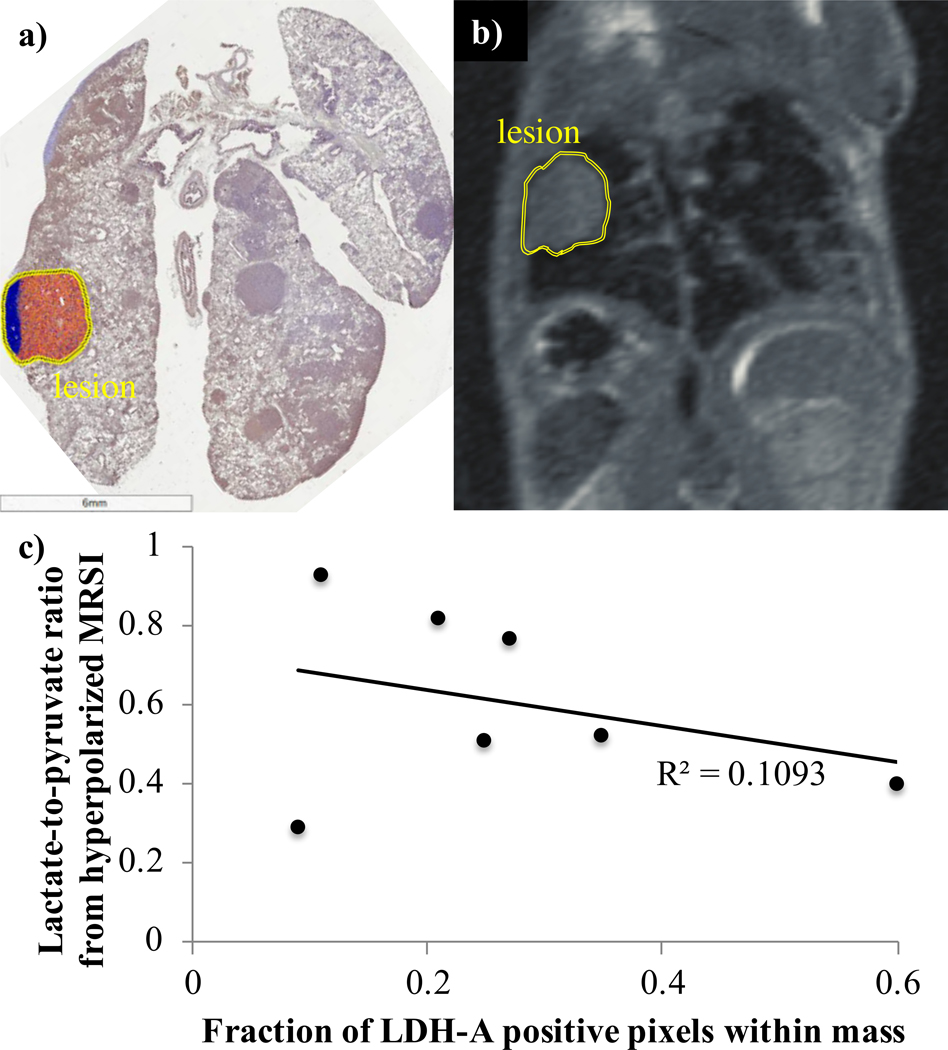
Figure 4.
Images from a) IHC staining for LDH in a sample of lung tissue, and b) the matching proton MRI, showing correspondence between the tissue sample and imaging. c) Scatter plot showing the lactate-to-pyruvate ratios from hyperpolarized 13C MRSI against the percentage of LDH-A positive pixels from corresponding samples of lung masses.

