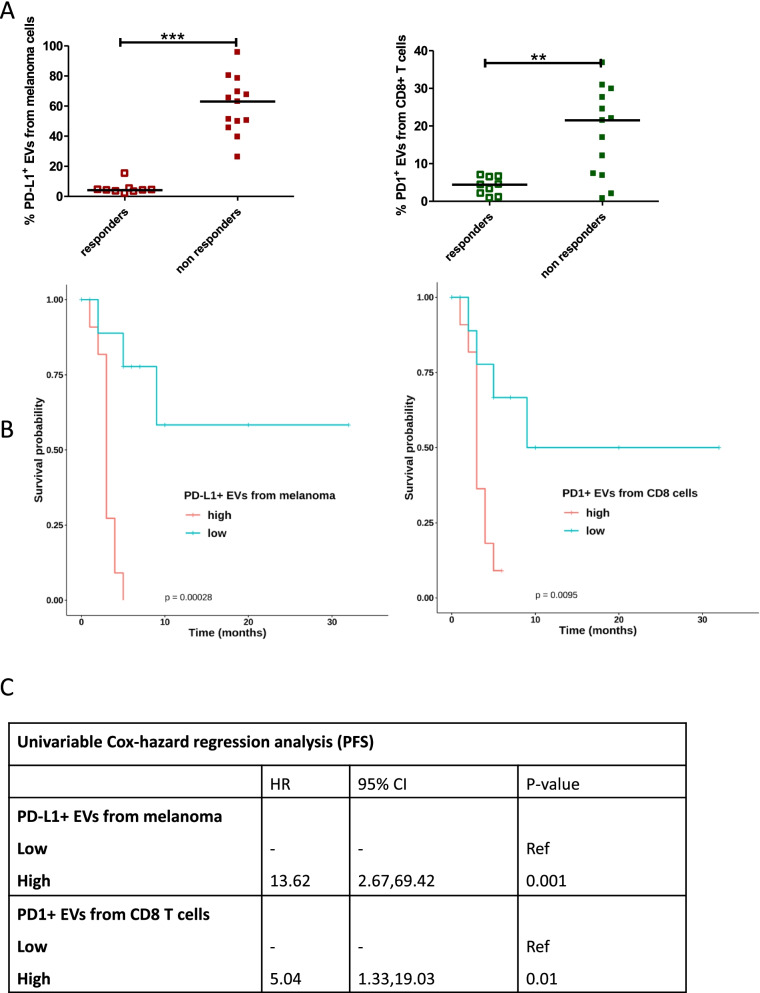
Fig. 6.
PD-L1+ EVs and PD1+ EVs from melanoma and T cells of responders and non-responders enrolled in the validation cohort. A Scatter plots with median of the percentage of PD-L1+ EVs from melanoma and PD1+ EVs from CD8 T cells isolated from responders (9) and non-responders (13) enrolled in the validation independent cohort (Mann Whitney t test **p < 0.05, *** p < 0.001). B Kaplan–Meier survival curve analysis according to PD-L1+ EVs quartiles, with PD-L1+ EVs from melanoma as respect to PFS, and according to PD1+ EVs quartiles, with PD1+ EVs from T cells as respect to PFS. C Univariable Cox-hazard regression analysis (PFS)

