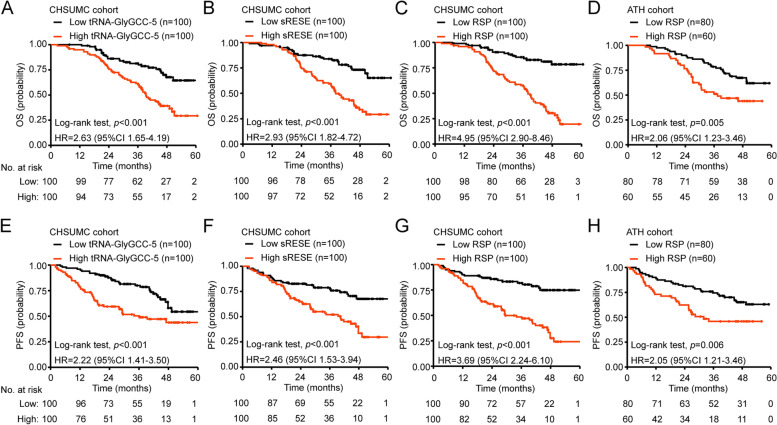
Fig. 3.
Performance of sesncRNAs for prognostication in CHSUMC and ATH cohorts. A-B and E-F Kaplan-Meier analysis shows that the OS and PFS were significantly longer in patients with low expression of tRNA-GlyGCC-5 (A and E) or sRESE (B and F) than those with high expression. C and G The sesncRNAs-based Risk Score for Prognosis (RSP) of each patient. Kaplan-Meier analysis shows that patients with low-RSP have longer OS (C) and PFS (G) than those with high-RSP in the CHSUMC cohort. D and H OS (D) and PFS (H) were significantly longer in patients with low RSP than those with high RSP in the ATH cohort. The p-values were calculated using the unadjusted log-rank test and hazard ratios (HR) using univariate Cox regression. CI, confidence interval

