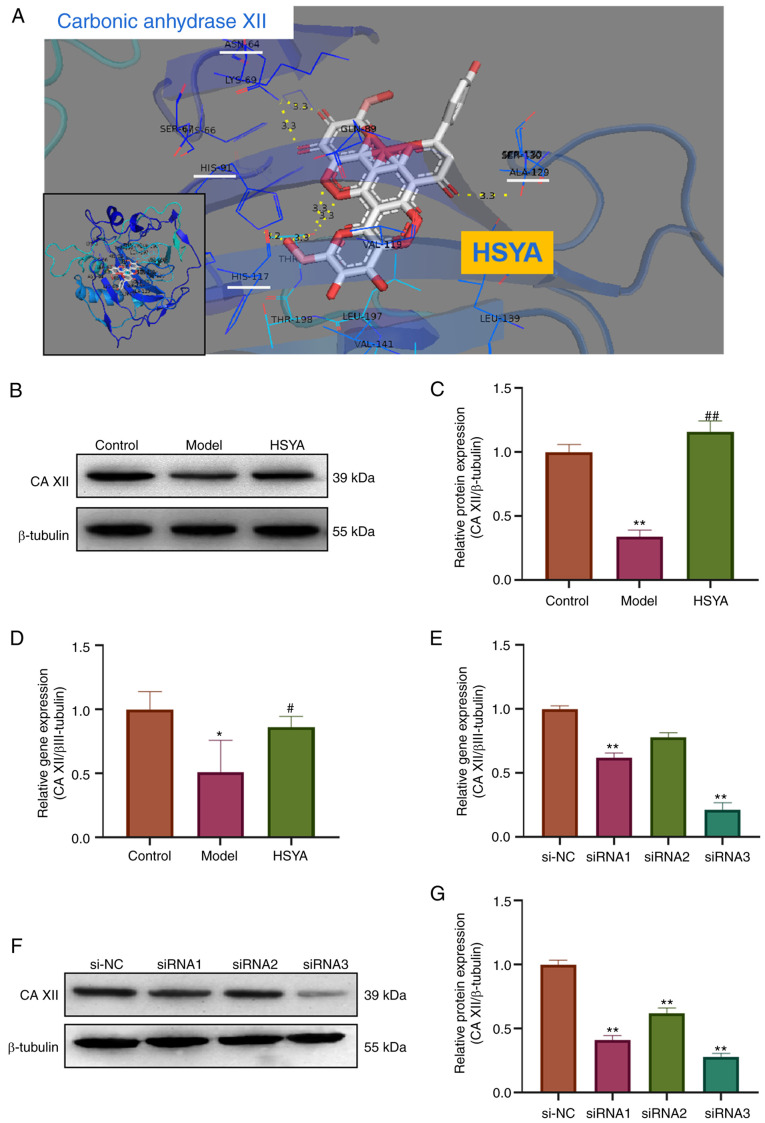
Figure 5.
Association between HSYA and CA XII. (A) Visual simulation docking results for the interaction site between HSYA and CA XII protein using Pymol software. (B) Western blot analysis was used to detect the protein expression level of CA XII and the results were (C) statistically analyzed. RT-qPCR was used to detect the mRNA expression level of (D) CA XII and (E) the inhibition rate of CA XII siRNA. (F) Western blot analysis was used to detect the protein expression level of CA XII and the results were (G) statistically analyzed. (C and D) *P<0.05, **P<0.01 vs. control; #P<0.05, ##P<0.01 vs. model; (E and G) **P<0.01 vs. si-NC. HSYA, hydroxysafflor yellow A; NC, negative control; si, small interfering; CA XII, carbonic anhydrase 12.

