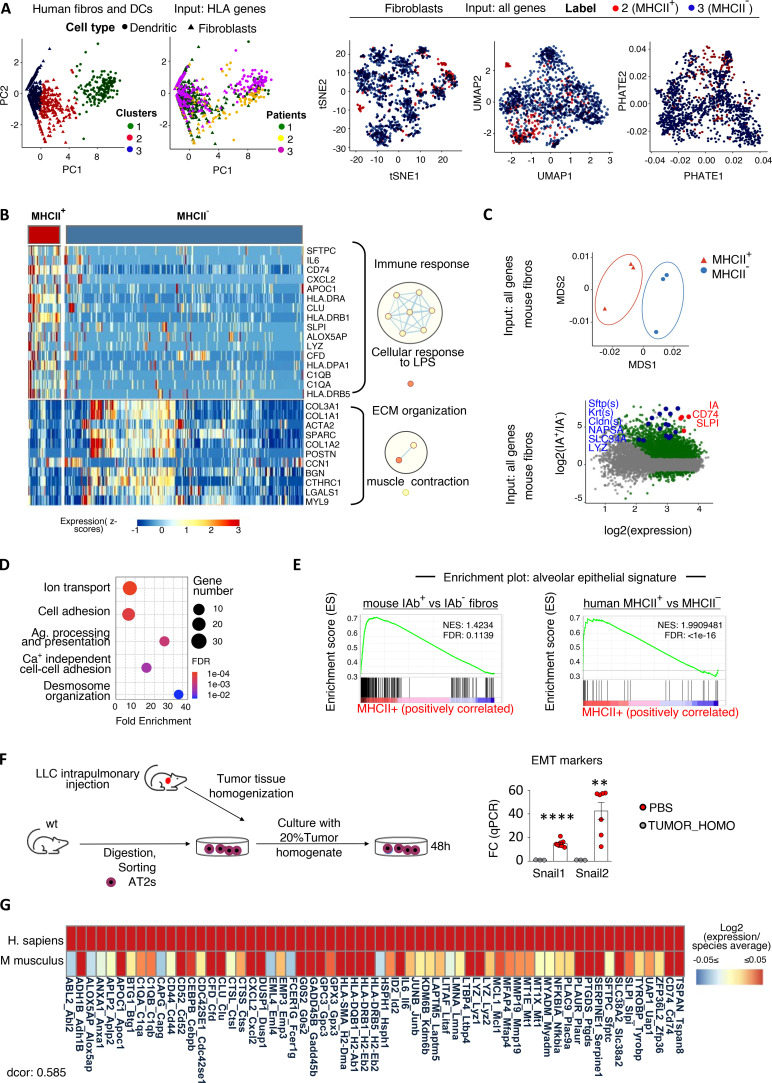
Figure 3.
MHCII fibroblasts closely relate to alveolar epithelial cells across mice and humans. (A) Fibroblast and DC scRNAseq datasets from lung tumors and adjacent lungs (E-MTAB-6149, -6653) were extracted and reclustered based only on MHCII genes to identify MHCII fibroblasts (fibros; n = 3 patients). (B) Heatmap of differentially expressed genes (adj. P values < 0.05) between MHCII+ and MHCII− fibroblasts. GO enrichment analysis was performed using DAVID. Network visualization was conducted by Cytoscape's EnrichmentMap. Nodes represent GO biological processes, and edges connect functional terms with overlapping genes. Clusters of related nodes are circled and given labels reflecting broad biological processes. GO terms with an FDR < 0.1 are shown. (C) Multidimensional scaling representation of bulk RNAseq data of sorted MHCII+ and MHCII− fibroblasts from pooled mouse LLC lung tumors (n = 3 experiments). Differential expression between MHCII+ and MHCII− fibroblasts. Deregulated genes with adj. P values < 0.05 are indicated. (D) GO enrichment analysis using up-regulated genes with |Log2FC| > 3 as input. (E) GSEA enrichment plots for alveolar epithelial gene sets. (F) Murine ATII cells were FACS sorted from healthy lungs and exposed ex vivo to tumor homogenate (TUMOR_HOMO). Expression of EMT genes was quantified by qPCR (n = 2 or 3, pooled from two experiments). (G) Homology analysis of gene expression across mouse and human MHCII fibroblasts. Tumor-homo, Tumor homogenate. (F) **, P < 0.01; ****, P < 0.0001. Error bars, mean ± SEM; two-tailed unpaired t test. LPS, lipopolysaccharides; Ag, antigen; NES, negative normalized enrichment score.

