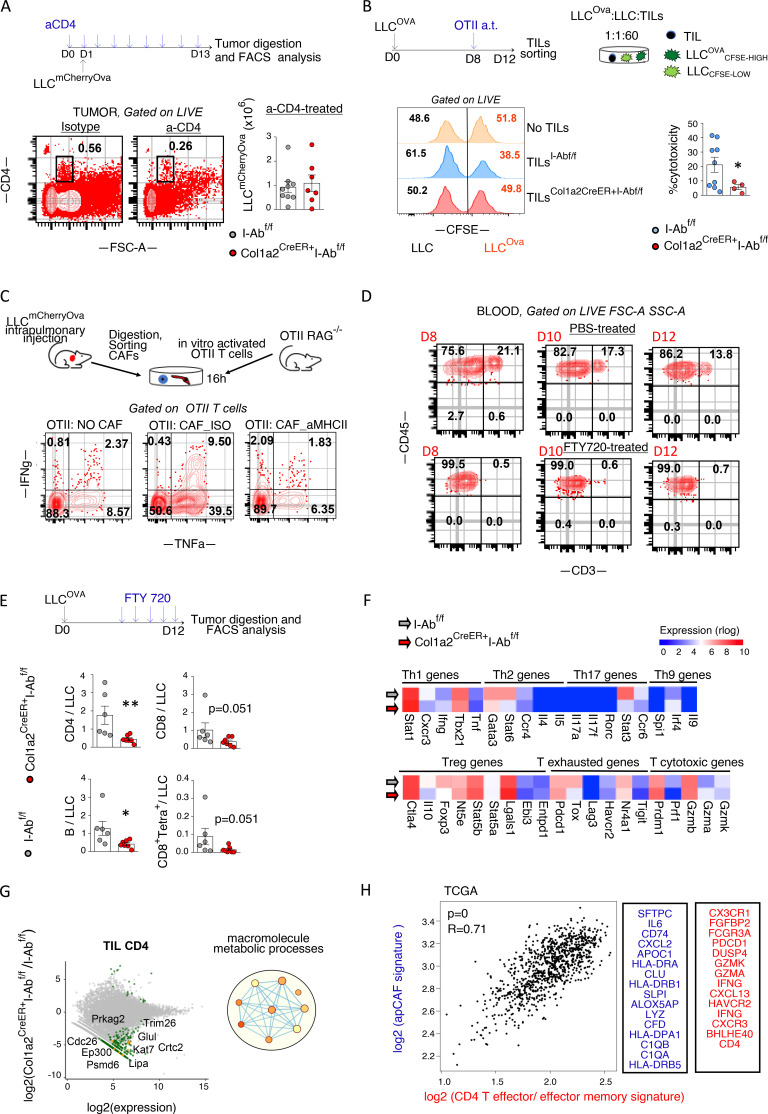
Figure 5.
Lung anti-tumor CD4 T cell responses depend on apCAF MHCII. (A) Col1a2 CreER+I-Abfl/fl and I-Abfl/fl mice were inoculated with LLCOva and treated with CD4 T cell–depleting antibody. Cumulative data of tumor burden (n = 3–6 per group, pooled from two experiments). Absolute numbers of tumor cells were assessed by FACS using counting beads. (B) Col1a2 CreER+I-Abfl/fl versus I-Abfl/fl mice bearing LLCOva lung tumors were adoptively (a.t.) transferred with OTII T cells. TILs were FACS sorted and incubated with CFSE-loaded LLCOva (CSFEhigh = 5 μM CFSE) plus LLC (CSFElow = 0.5 μM CFSE) cells at a 60:1:1 ratio. Cytotoxicity was determined at 16 h by quantifying the ratio of LLCOva to LLC (n = 2–5 per group, pooled from two experiments). Representative and cumulative FACS data are shown. (C) CAFs from LLCOva lung tumor–bearing mice were sorted and co-cultured with OTII T cells from OTII RAG−/− mice at a 1:1 ratio plus MHCII-blocking antibody or isotype (ISO) control. Representative FACS plots of intracellular cytokines (n = 2 or 3 per group, representative of two experiments). (D) Depletion of circulating T cells upon FTY720 treatment. Representative FACS plots. (E) Lung tumor Col1a2 CreER+I-Abfl/fl versus I-Abfl/fl mice were treated with FTY720. Lung tumors were excised and analyzed by FACS (n = 6 or 7 per group, pooled from two experiments). (F and G) Intratumoral lung CD4 T cells were purified from Col1a2 CreER+I-Abfl/fl versus I-Abfl/fl mice (n = 7) and analyzed by bulk RNAseq. Expression heatmaps (mean values) of marker genes (F). MA (M [log ratio] and A [mean average]) plots and GO term enrichment analysis, with nodes in the networks representing biological processes and edges connecting terms with overlapping genes (G). Adj. P values > 0.05, except from: Stat6 0.0042, Stat3:0.0053 (F). Deregulated genes with FDR < 0.01 and GO terms with an FDR < 0.1 are shown (G). (H) Left: Pearson correlation analysis between CD4 effector/effector memory T cell and apCAF signature genes in patients with lung adenocarcinoma and squamous cell carcinoma in The Cancer Genome Atlas [TCGA], GEPIA2). Right: Input gene lists. (A, B, and E) *, P < 0.05; **, P < 0.01. Error bars, mean ± SEM; two-tailed Mann-Whitney U test. aMHCII, pan-MHCII blocking antibody; FSC-A, forward scatter-A; SSC-A, side scatter-A.

