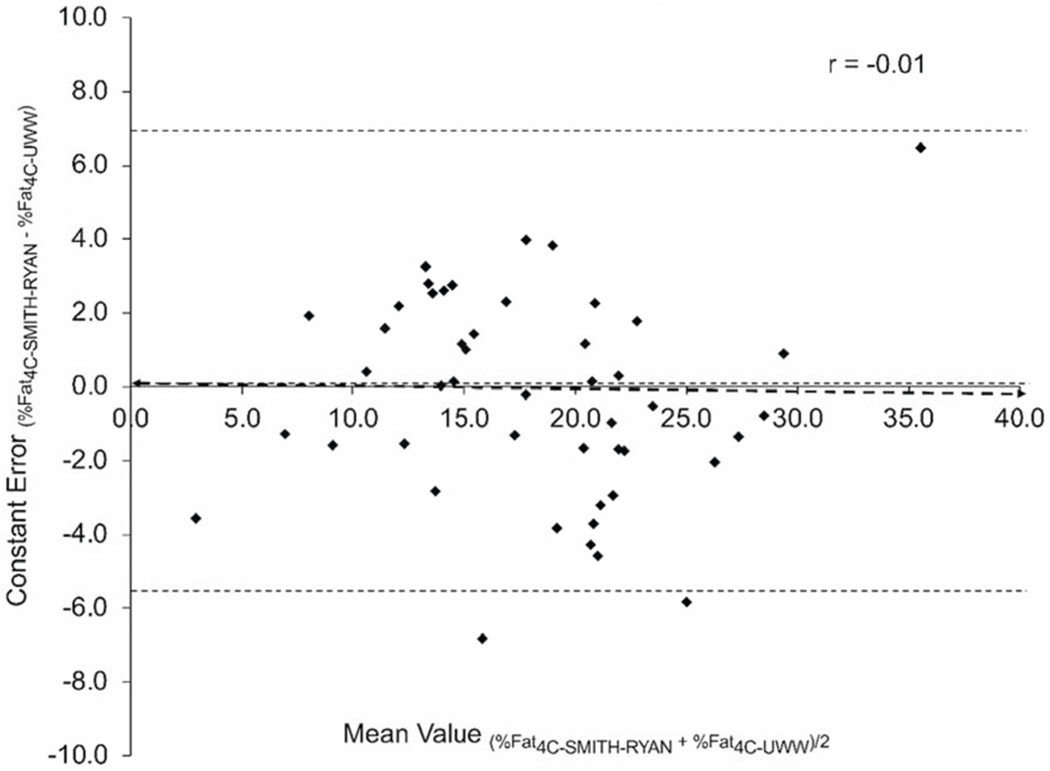
Fig. 2. Bland–Altman plot of the difference between relative adiposity (%Fat) measured using DXA-derived body volume (%Fat4C-Smith-Ryan) and the 4-compartment underwater weighing criterion method (%Fat4C-UWW).

The heavy-dashed line indicates the line of best fit. The fine-dotted line in the middle indicates the mean difference, and the dotted lines at the top and bottom of the graph indicate the upper and lower 95% limits of agreement.
