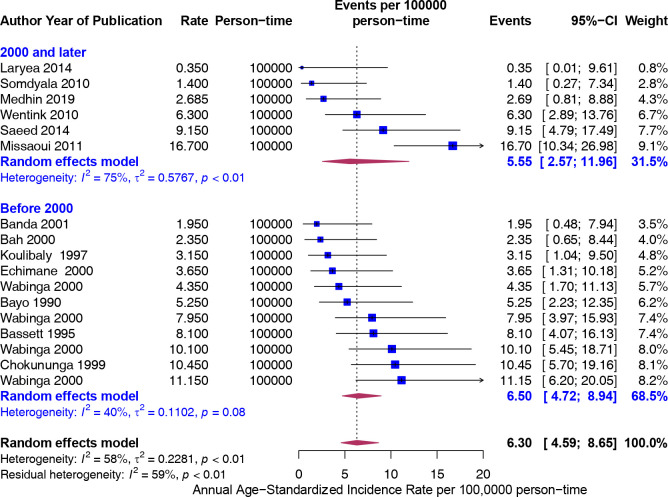
Figure 5.
Age-standardised incidence rates (ASIR) (per 100 000 population) of colorectal cancer in Africa stratified by year of study (before 2000 and before, 2000 and after). Event values represent the ASIRs of colorectal cancer per 100 000 population. Blue squares and their corresponding lines are the point estimates and 95% CIs. Maroon diamonds represent the pooled estimate of the ASIR, overall and by year categorised as before and after 2000 (width denotes 95% CI). There is no difference in the rates between the year categories.

