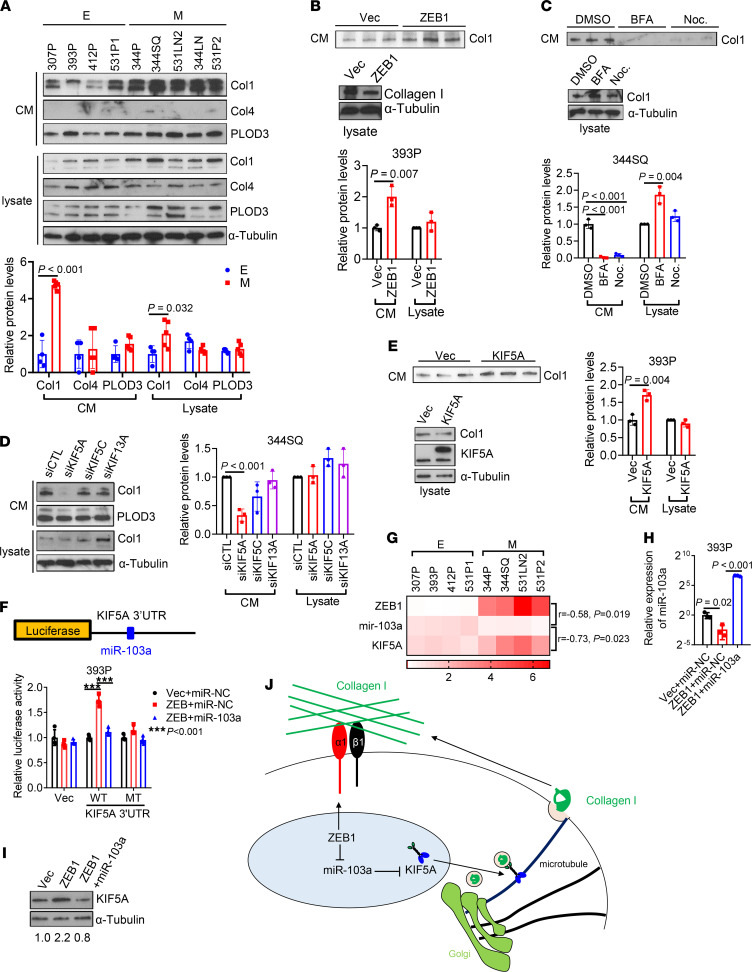
Figure 6. ZEB1 accelerates Col1 secretion.
(A) Western blot analysis of Col1, Col4, and PLOD3 in conditioned medium (CM) and cell lysates from KP cell lines. Protein levels were quantified. α-Tubulin was used as a loading control. E, epithelial; M, mesenchymal. (B and C) Western blot analysis of Col1 levels in CM and cell lysates from 393P_Vec and 393P_ZEB1 cells (B) and 344SQ cells treated with brefeldin A (BFA), nocodazole (Noc.), or vehicle (DMSO; C). (D) Western blot analysis of Col1 and PLOD3 in CM and cell lysates from 344SQ transfectants. α-Tubulin was used as a loading control. Col1 protein levels were quantified. (E) Western blot analysis of Col1 and KIF5A in CM and cell lysates from 393P transfectants. α-Tubulin was used as a loading control. Col1 protein levels were quantified. (F) Schema showing luciferase reporter containing KIF5A 3′-UTR that has a miR-103a–binding site. Luciferase reporter assays in 393P cells transfected with reporters containing wild-type KIF5A 3′-UTR or 3′-UTR with mutant miR-34a binding site (MT), ZEB1 expression vector or control vector, and miR-103a mimics or control miRNA mimics (miR-NC). (G) Heatmap showing the expression levels of ZEB1, miR-103a, and KIF5A in KP cell lines. r and P values were calculated by Pearson correlation. (H) Quantitative reverse transcription PCR analysis of miR-103a in 393P transfectants. (I) Western blot analysis of KIF5A in 393P transfectants. Relative KIF5A protein levels were quantified. (J) Schema showing that ZEB1 drives Col1 secretion by upregulating KIF5A and enhances cell adhesion to Col1 by increasing Itga1. Data are shown as the mean ± SEM from a single experiment incorporating biological replicate samples (n = 3, unless otherwise indicated) and are representative of at least 2 independent experiments. Two-tailed Student’s t test for 2-group comparisons; 1-way ANOVA test for multiple comparisons.

