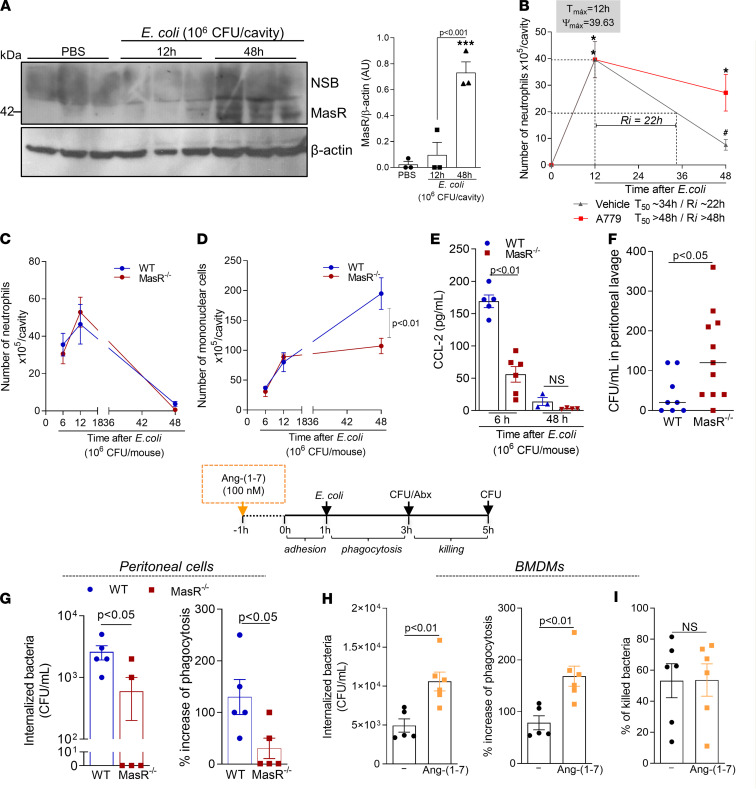
Figure 7. The Ang-(1-7)/MasR pathway promotes the recruitment of macrophages, production of CCL2, and phagocytosis of bacteria.
WT mice were infected with E. coli (1 × 10⁶ CFU), and macrophages were harvested at 12 and 48 hours postinfection for MasR expression (A, n = 3). Macrophages from PBS-injected mice were used as controls. Next, infected mice were treated with A779 (200 ng/cavity) or vehicle, and neutrophil numbers at 12 and 48 hours postinfection were evaluated to calculate the resolution intervals (Ri — B). T50, time point when neutrophil numbers reduced to 50% of maximum (n = 7). In addition, WT and MasR–/– mice were infected, and the numbers of neutrophils (C) and macrophages (D) was evaluated at different time points postinfection. CCL2 levels were measured in the cell-free supernatants of the peritoneal lavages at 6 and 48 hours postinfection (E). (F) Graph shows the CFU numbers in the lavage at 6 hours postinfection (n = 5–11). Phagocytosis of bacteria was evaluated in peritoneal macrophages from naive WT and MasR–/– (G) or WT BMDMs pretreated with Ang-(1-7) — 100 nM (H). Results are expressed as CFU of internalized bacteria or percentage of phagocytosis (n = 5–6). In a parallel experiment, macrophages were incubated for another 2 hours after antibiotics to assess the killing of bacteria inside the macrophages by evaluating the number of viable bacteria (CFU counts in LB agar plates — I). Data are presented as the mean ± SEM, * for P < 0.05 and *** for P < 0.001, when compared with the control group (PBS), or # for P < 0.05 when compared with the A779-treated group, by 1-way ANOVA or t test (when comparing 2 groups).

