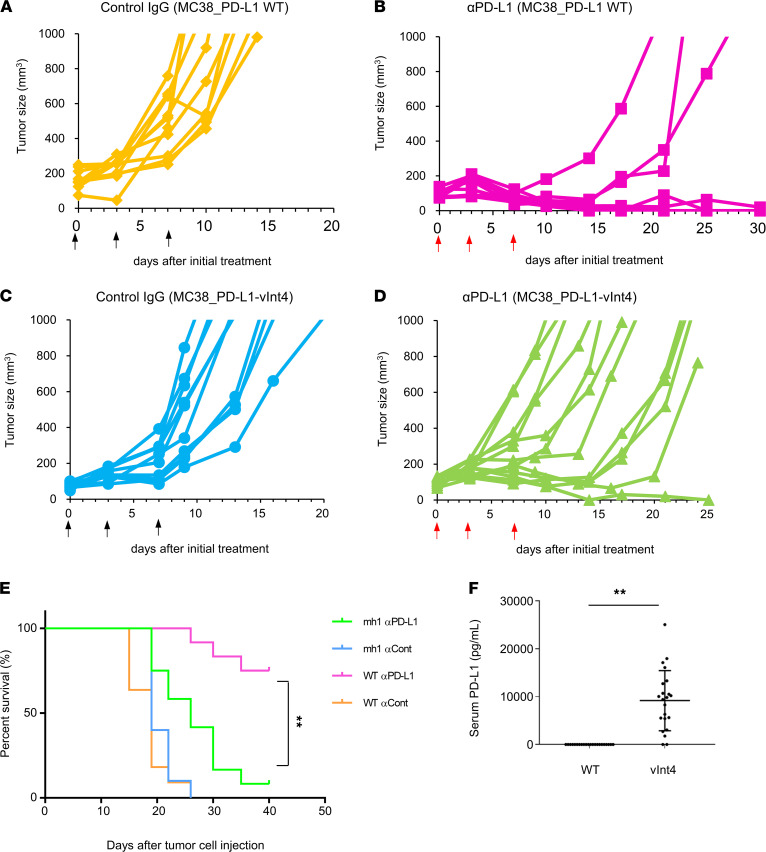
Figure 6. PD-L1–vInt4-overexpressed mice displayed resistance in αPD-L1 treatment.
(A–D) Mice were injected with 5 × 10⁵ MC38 cells with overexpression of WT PD-L1 or PD-L1–vInt4 and treated with 75 μg of anti–PD-L1 or control IgG 3 times a week by i.p. injection. n = 10–12 mice/group. Similar experiments were performed 3 times. Each line represents the tumor volumes for each mouse. Each figure represents a mice group of: (A) MC38_mPD-L1 WT, treated with control IgG; (B) MC38_mPD-L1 WT, treated with αPD-L1; (C) MC38_mPD-L1–vInt4, treated with control IgG; or (D) MC38_mPD-L1–vInt4, treated with αPD-L1. The regimen of treatment is indicated by black arrows for control IgG and red arrows for αPD-L1. (E) Kaplan-Meier curves of treated mouse groups in A–D. **P < 0.01 by Gehan-Breslow-Wilcoxon test. (F) Serum PD-L1 levels of mice in experiments A–D were sequentially measured by ELISA. Sera were collected just before the endpoint of the experiment or at sacrificing. Data represent mean ± SEM. **P < 0.01 by 2-sided Mann-Whitney U test. Similar experiments are conducted twice for A–F.

