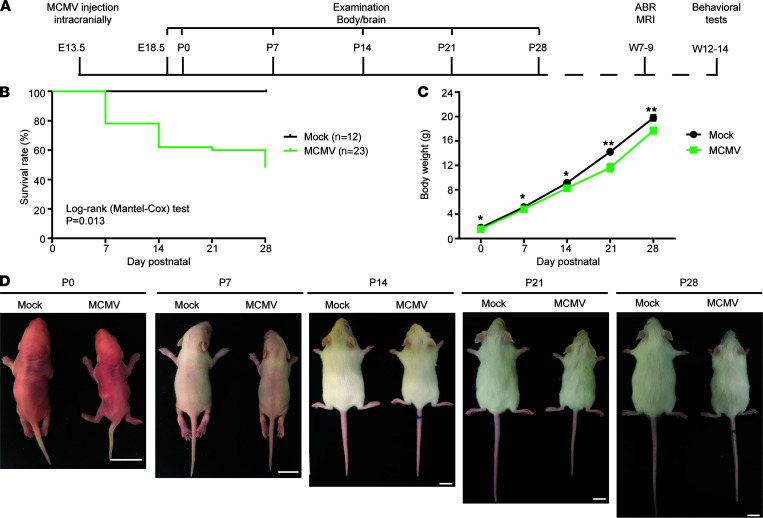
Figure 1. A cMCMV infection mouse model for follow-up studies of neurodevelopmental disorders.
(A) Timeline. A dose of 20 PFU MCMV or equivalent conditioned media (Mock) was injected intracranially at E13.5. The bodies and brains of the mice were examined weekly from P0 to P28, or longer depending on experiments. Neuroimaging by MRI and auditory brainstem evoked response (ABR) tests were performed at 7–9 weeks postnatally (W7-9), and neurological tests were performed at W12–14. (B) Survival rates. Survival curves of mock- and MCMV-infected newborns from P0 to P28 are shown; the Mantel-Cox test was used for survival analysis. (C) Body weights. Body weights were measured weekly from P0 to P28. Data were analyzed by 2-tailed Student’s t test and results are presented as mean ± SEM. *, P < 0.05; **, P < 0.01. (D) General growth. Representative whole mouse images at the indicated time points are shown. Scale bar: 10 mm.

