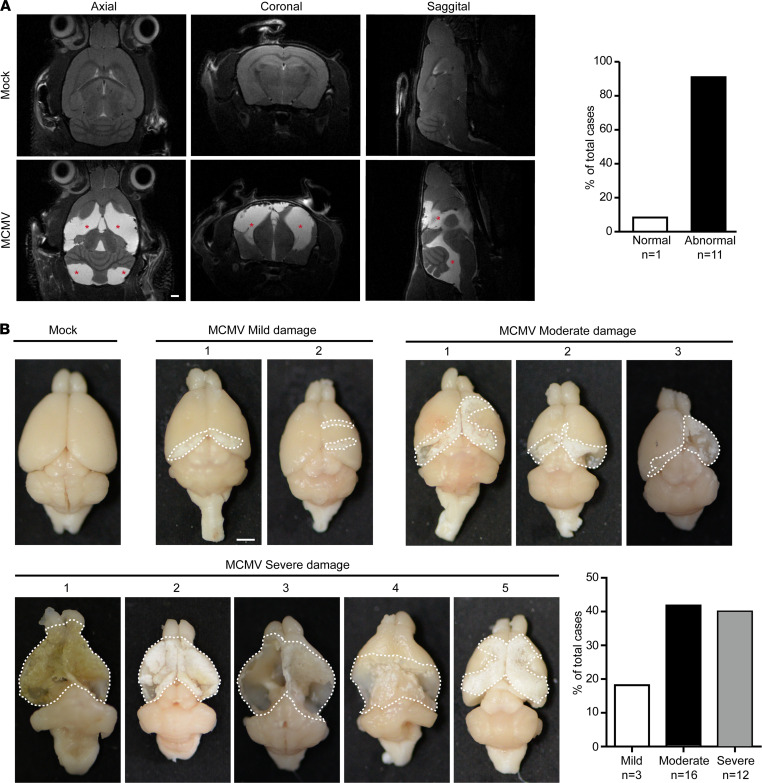
Figure 3. Altered neuroimaging findings and loss of brain parenchyma in infected mice.
(A) Neuroimaging (anatomical imaging) by MRI. Brain damage was monitored by MRI at W8–9. Axial, sagittal, and coronal views of representative mock and MCMV-infected brains are shown, and abnormal hyperintense signals are indicated by red asterisks. In the MCMV-infected group the percentages of cases with or without abnormal hyperintense signals among the total cases were calculated. Sample size n is indicated. Scale bar: 1 mm. (B) Pathological examination of brain damage. Representative images of W14 mouse brains following neurological tests are shown. Damaged areas outlined by white dashed lines were measured. Brain damage was classified into mild (0%~30%), moderate (30%~70%), and severe (>70%) groups according to the percentage of damaged area to the total area of the brain. The proportions of cases in each group to total cases were calculated and presented. Sample size n is indicated. Scale bar: 2 mm.

